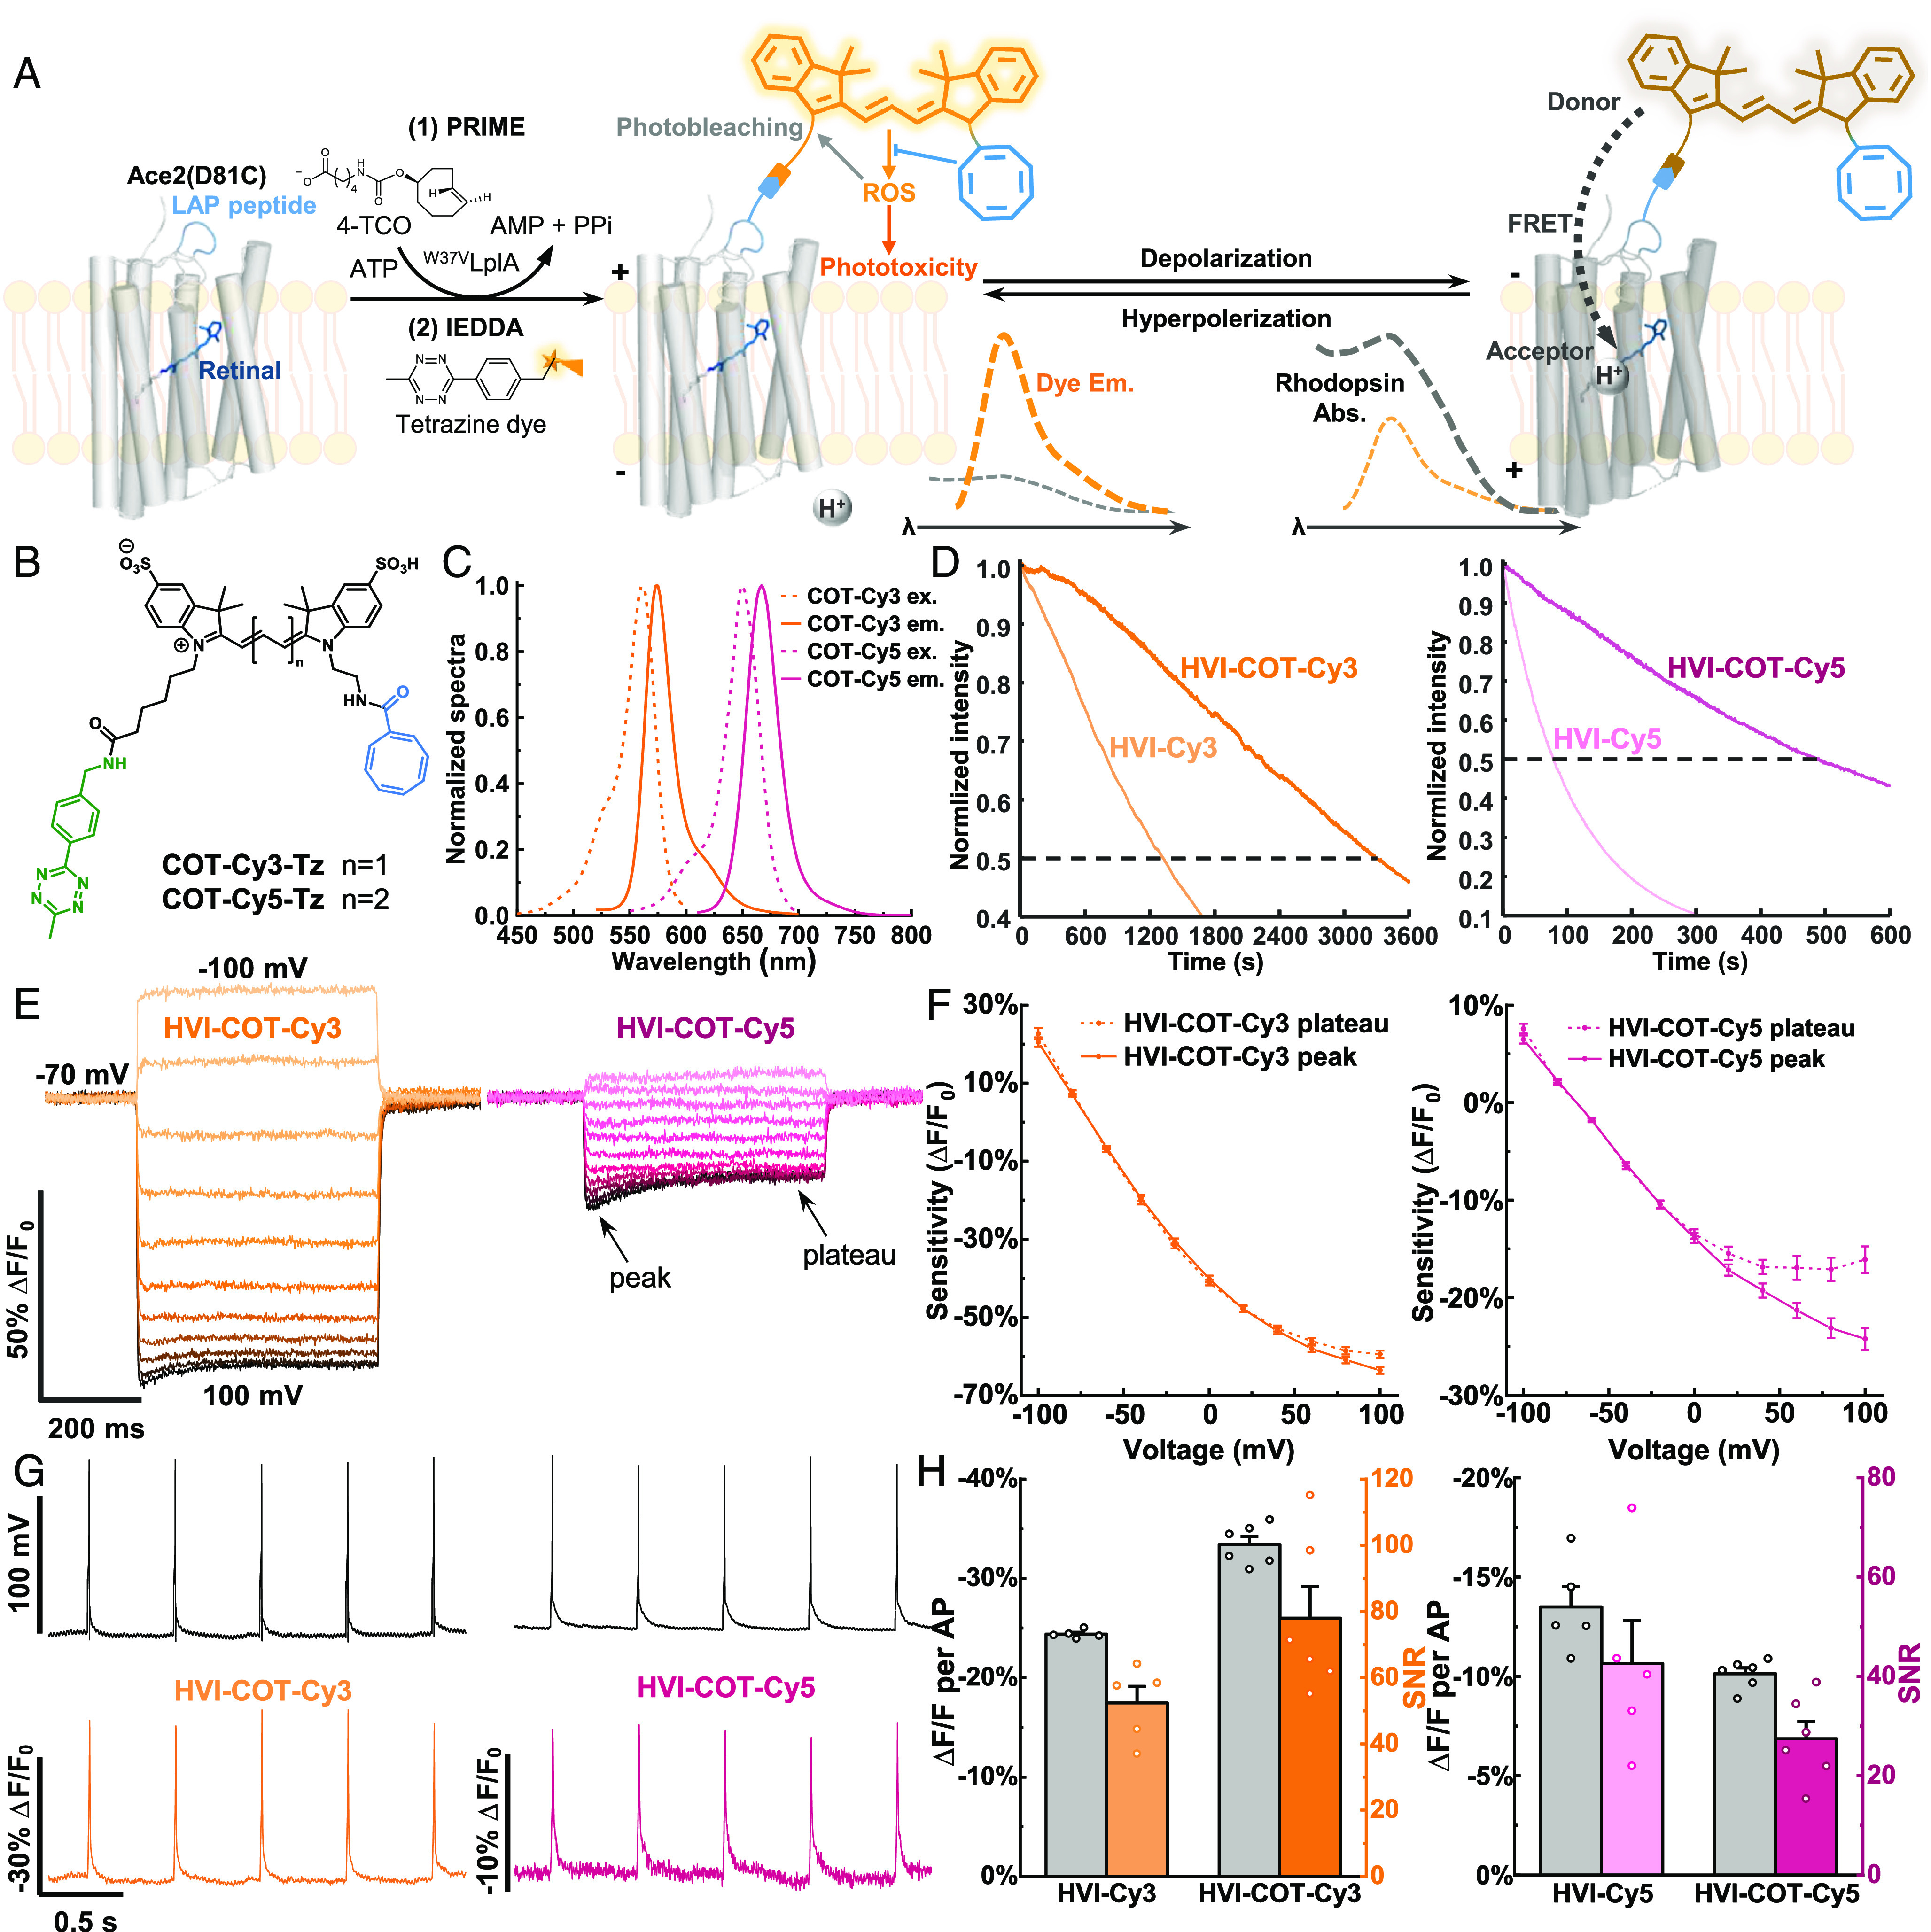
Fig. 1.

Design and characterizations of HVI–COT–Cy3 and HVI–COT–Cy5. (A) Scheme for the mechanisms of fluorophore labeling, voltage sensing, photobleaching, and phototoxicity of HVI. HVI achieves fluorophore conjugation via two-step labeling methods. In the first step, an engineered lipoic acid ligase mutant (W37VLplA) introduces trans-cyclooctene substrate (4-TCO) to LAP peptide. In the second step, tetrazine dye reacts with 4-TCO in a click manner. (B) Chemical structures of COT–Cy3–Tz and COT–Cy5–Tz. (C) Tetrazine dyes were reacted with equimolar 4-TCO and their excitation and emission spectra were measured in Tyrode’s buffer. (D) Photostability comparison between HVI–COT–cyanine dyes and HVI–cyanine dyes labeled on fixed cells. Representative normalized photobleaching curves of HVI–COT–Cy3/HVI–Cy3 (Left), and HVI–COT–Cy5/HVI–Cy5 (Right) at 10 Hz. The illumination intensities of 532 nm and 637 nm lasers were 8 W•cm−2 and 2 W•cm−2, respectively. (E and F) Voltage sensitivities characterization of HVI–COT–Cy3 and HVI–COT–Cy5 on HEK293T cells. (E) Representative fluorescence response of HVI–COT–Cy3 (Left) and HVI–COT–Cy5 (Right) to a series of step waveforms from −100 mV to 100 mV in increments of 20 mV applied by whole-cell patch clamp. (F) Voltage-fluorescence change plots. Responses were normalized to the fluorescence at −70 mV. Error bars represent SEM. (G and H) Sensitivities of HVI–COT–Cy3 and HVI–COT–Cy5 in neurons. (G) Representative single trial recordings of APs and fluorescence responses of HVI–COT–Cy3 (Left) and HVI–COT–Cy5 (Right) in neurons. Image sampling rates were 484 Hz. (H) AP sensitivities and SNR comparison of HVI–COT–Cy3/HVI–Cy3 (Left) and HVI–COT–Cy5/HVI–Cy5 (Right). The illumination intensities of 532 nm and 637 nm lasers were 5 W•cm−2 and 1.5 W•cm−2, respectively. Error bars represent SEM.
