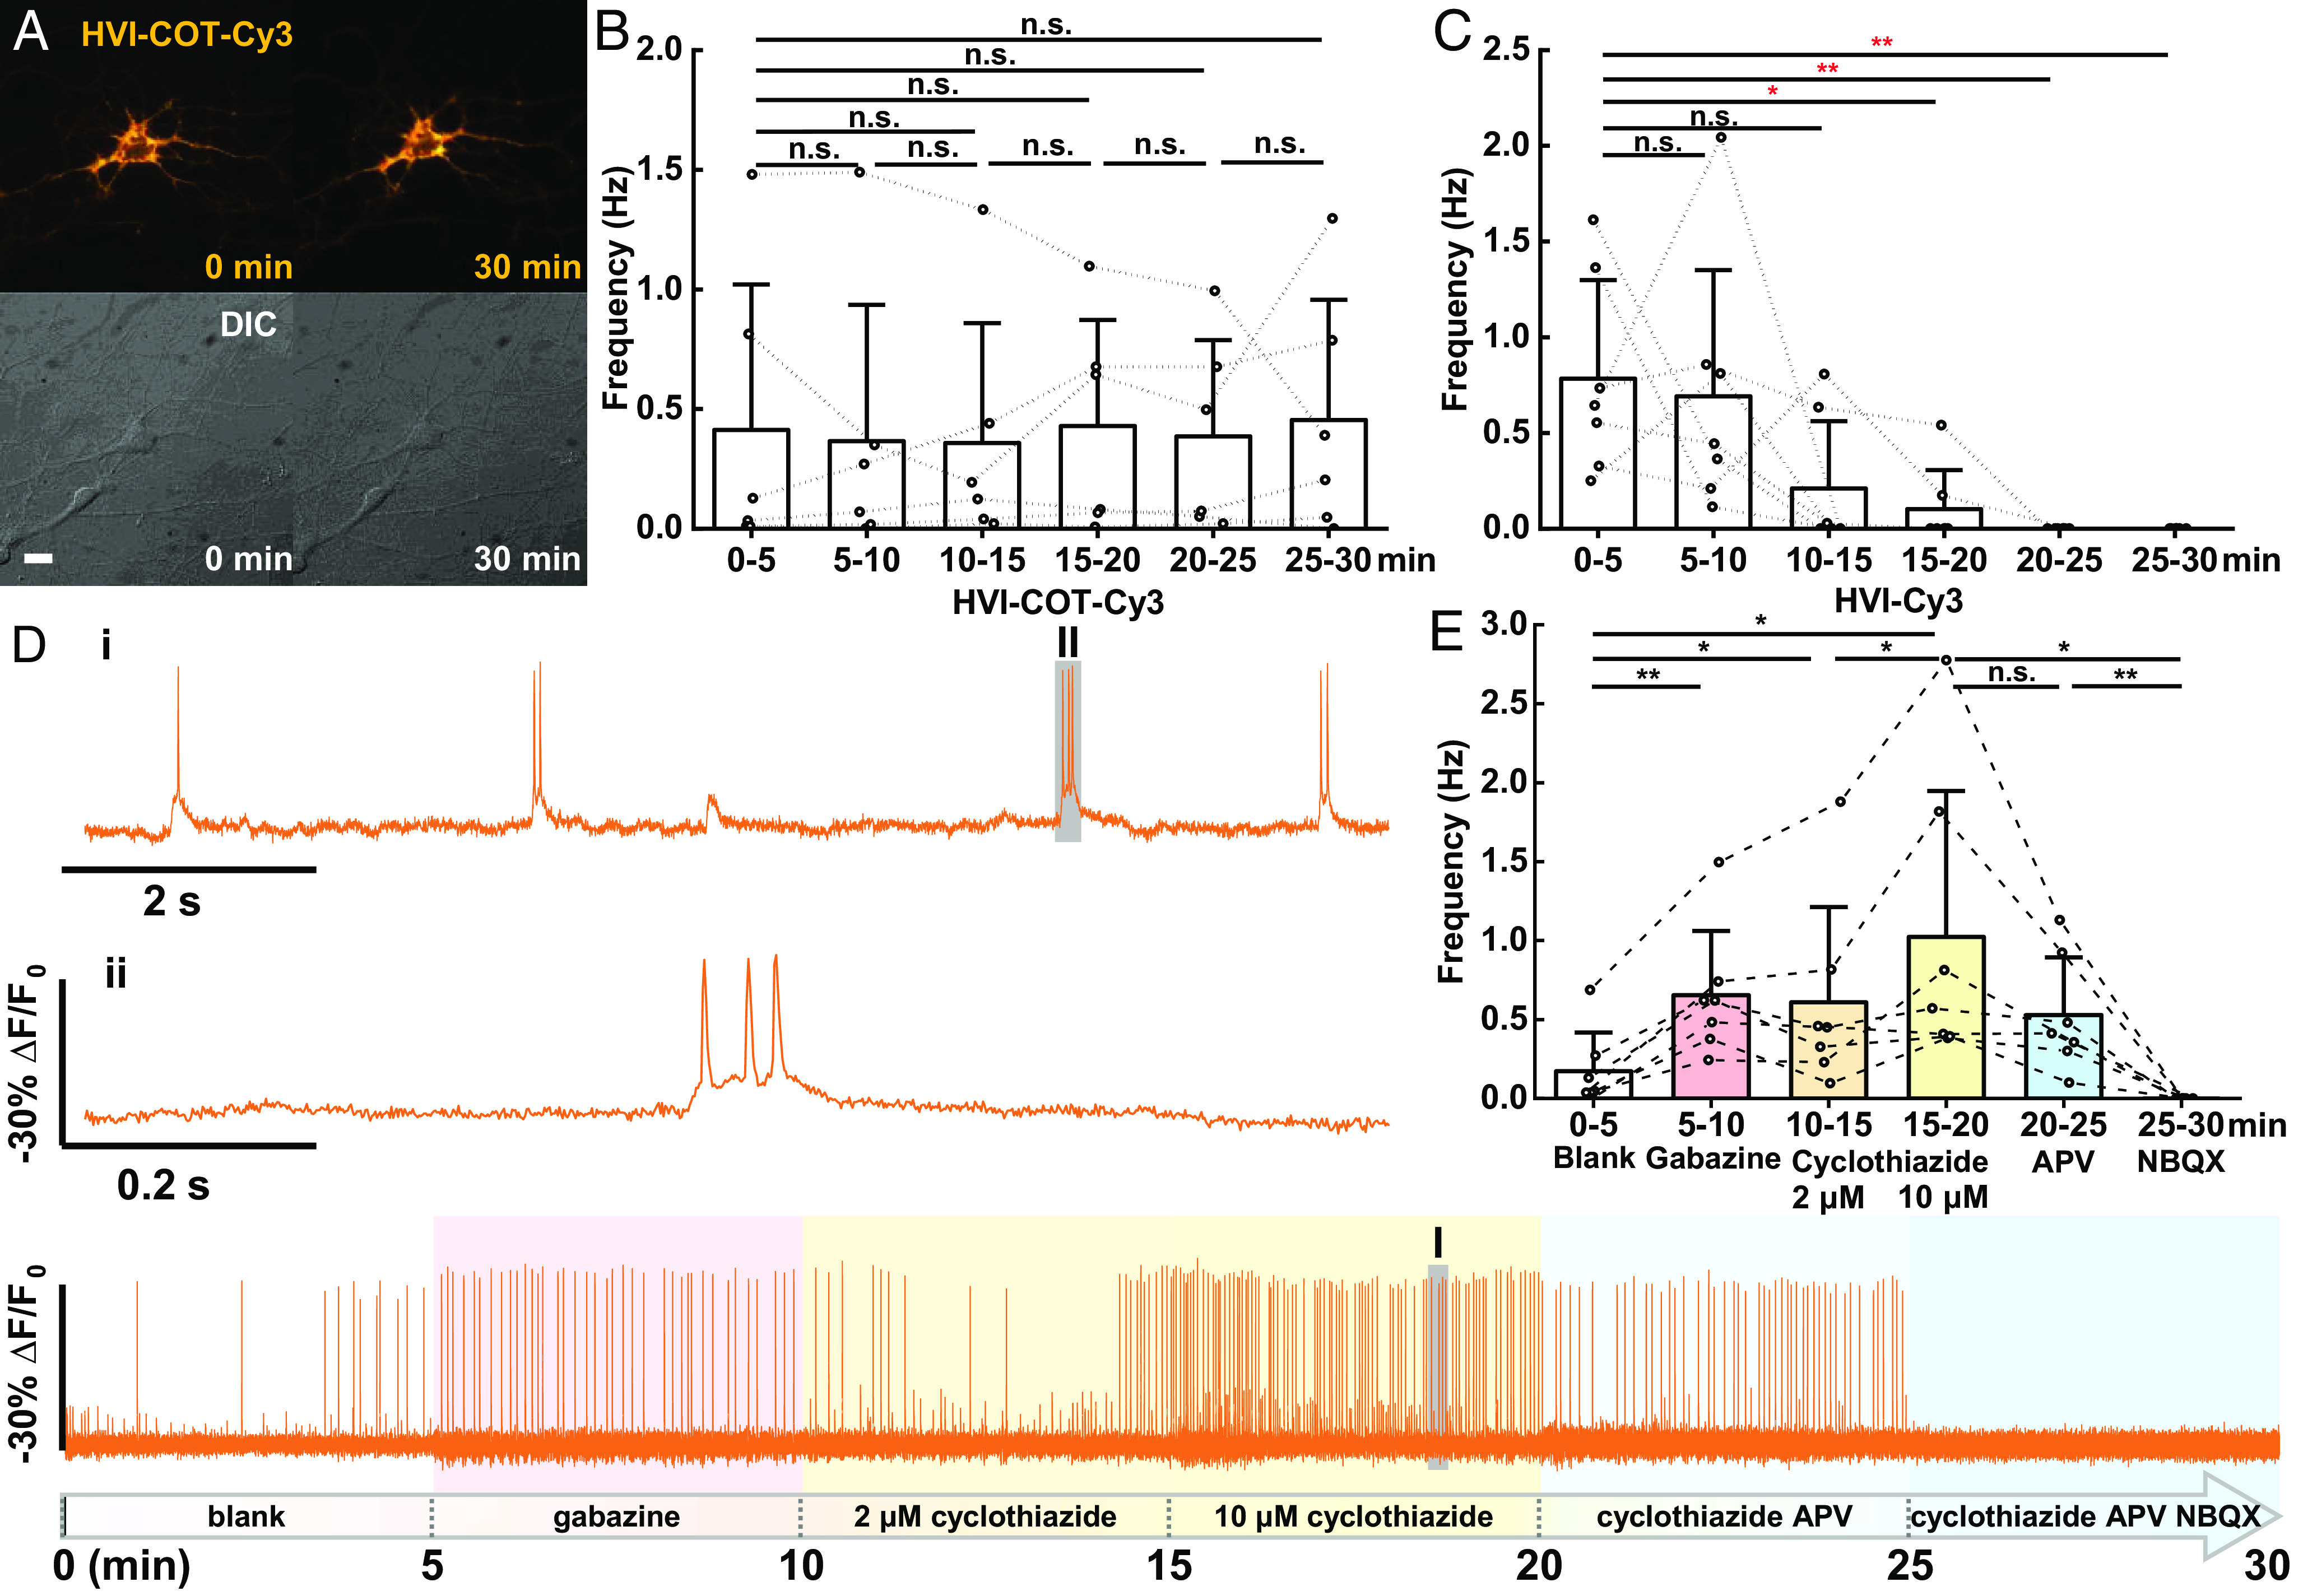
Fig. 2.

HVI–COT–Cy3 enables 30-min long-term voltage imaging (720,000 frames) in neurons. (A) Wide-field imaging of neuron expressing HVI–COT–Cy3 before/after continuous illumination. (Scale bar, 20 μm.) (B and C) Statistics of AP burst frequency in cultured neurons during six rounds of 5-min voltage imaging. Imaging was performed for each neuron expressing HVI–COT–Cy3 (B, n = 6 cells) or HVI–Cy3 (C, n = 7 cells). Statistical significances are determined by one-way repeated measures ANOVA. (D) Drugs were treated before each round of recording: 20 μM gabazine was treated before the 2nd round and was replaced by 2 μM cyclothiazide before the 3rd round, cyclothiazide was additionally added to 10 μM before the 4th round, then 25 μM APV and 10 μM NBQX were added successively in the last two rounds. The signal of HVI–COT–Cy3 was photobleaching corrected. Two zoomed-in signals (i and ii) from two shaded regions (I and II) were presented on the top. The illumination intensity of the 532 nm laser was 1.5 W•cm−2, and the camera frame rate was 400 Hz. (E) Statistics of AP frequency during each round of recording with drug treatment (n = 7 cells). Statistical significances are determined by a two-sided paired t test (*P < 0.05, **P < 0.01; n.s., not significant). Error bars represent SD.
