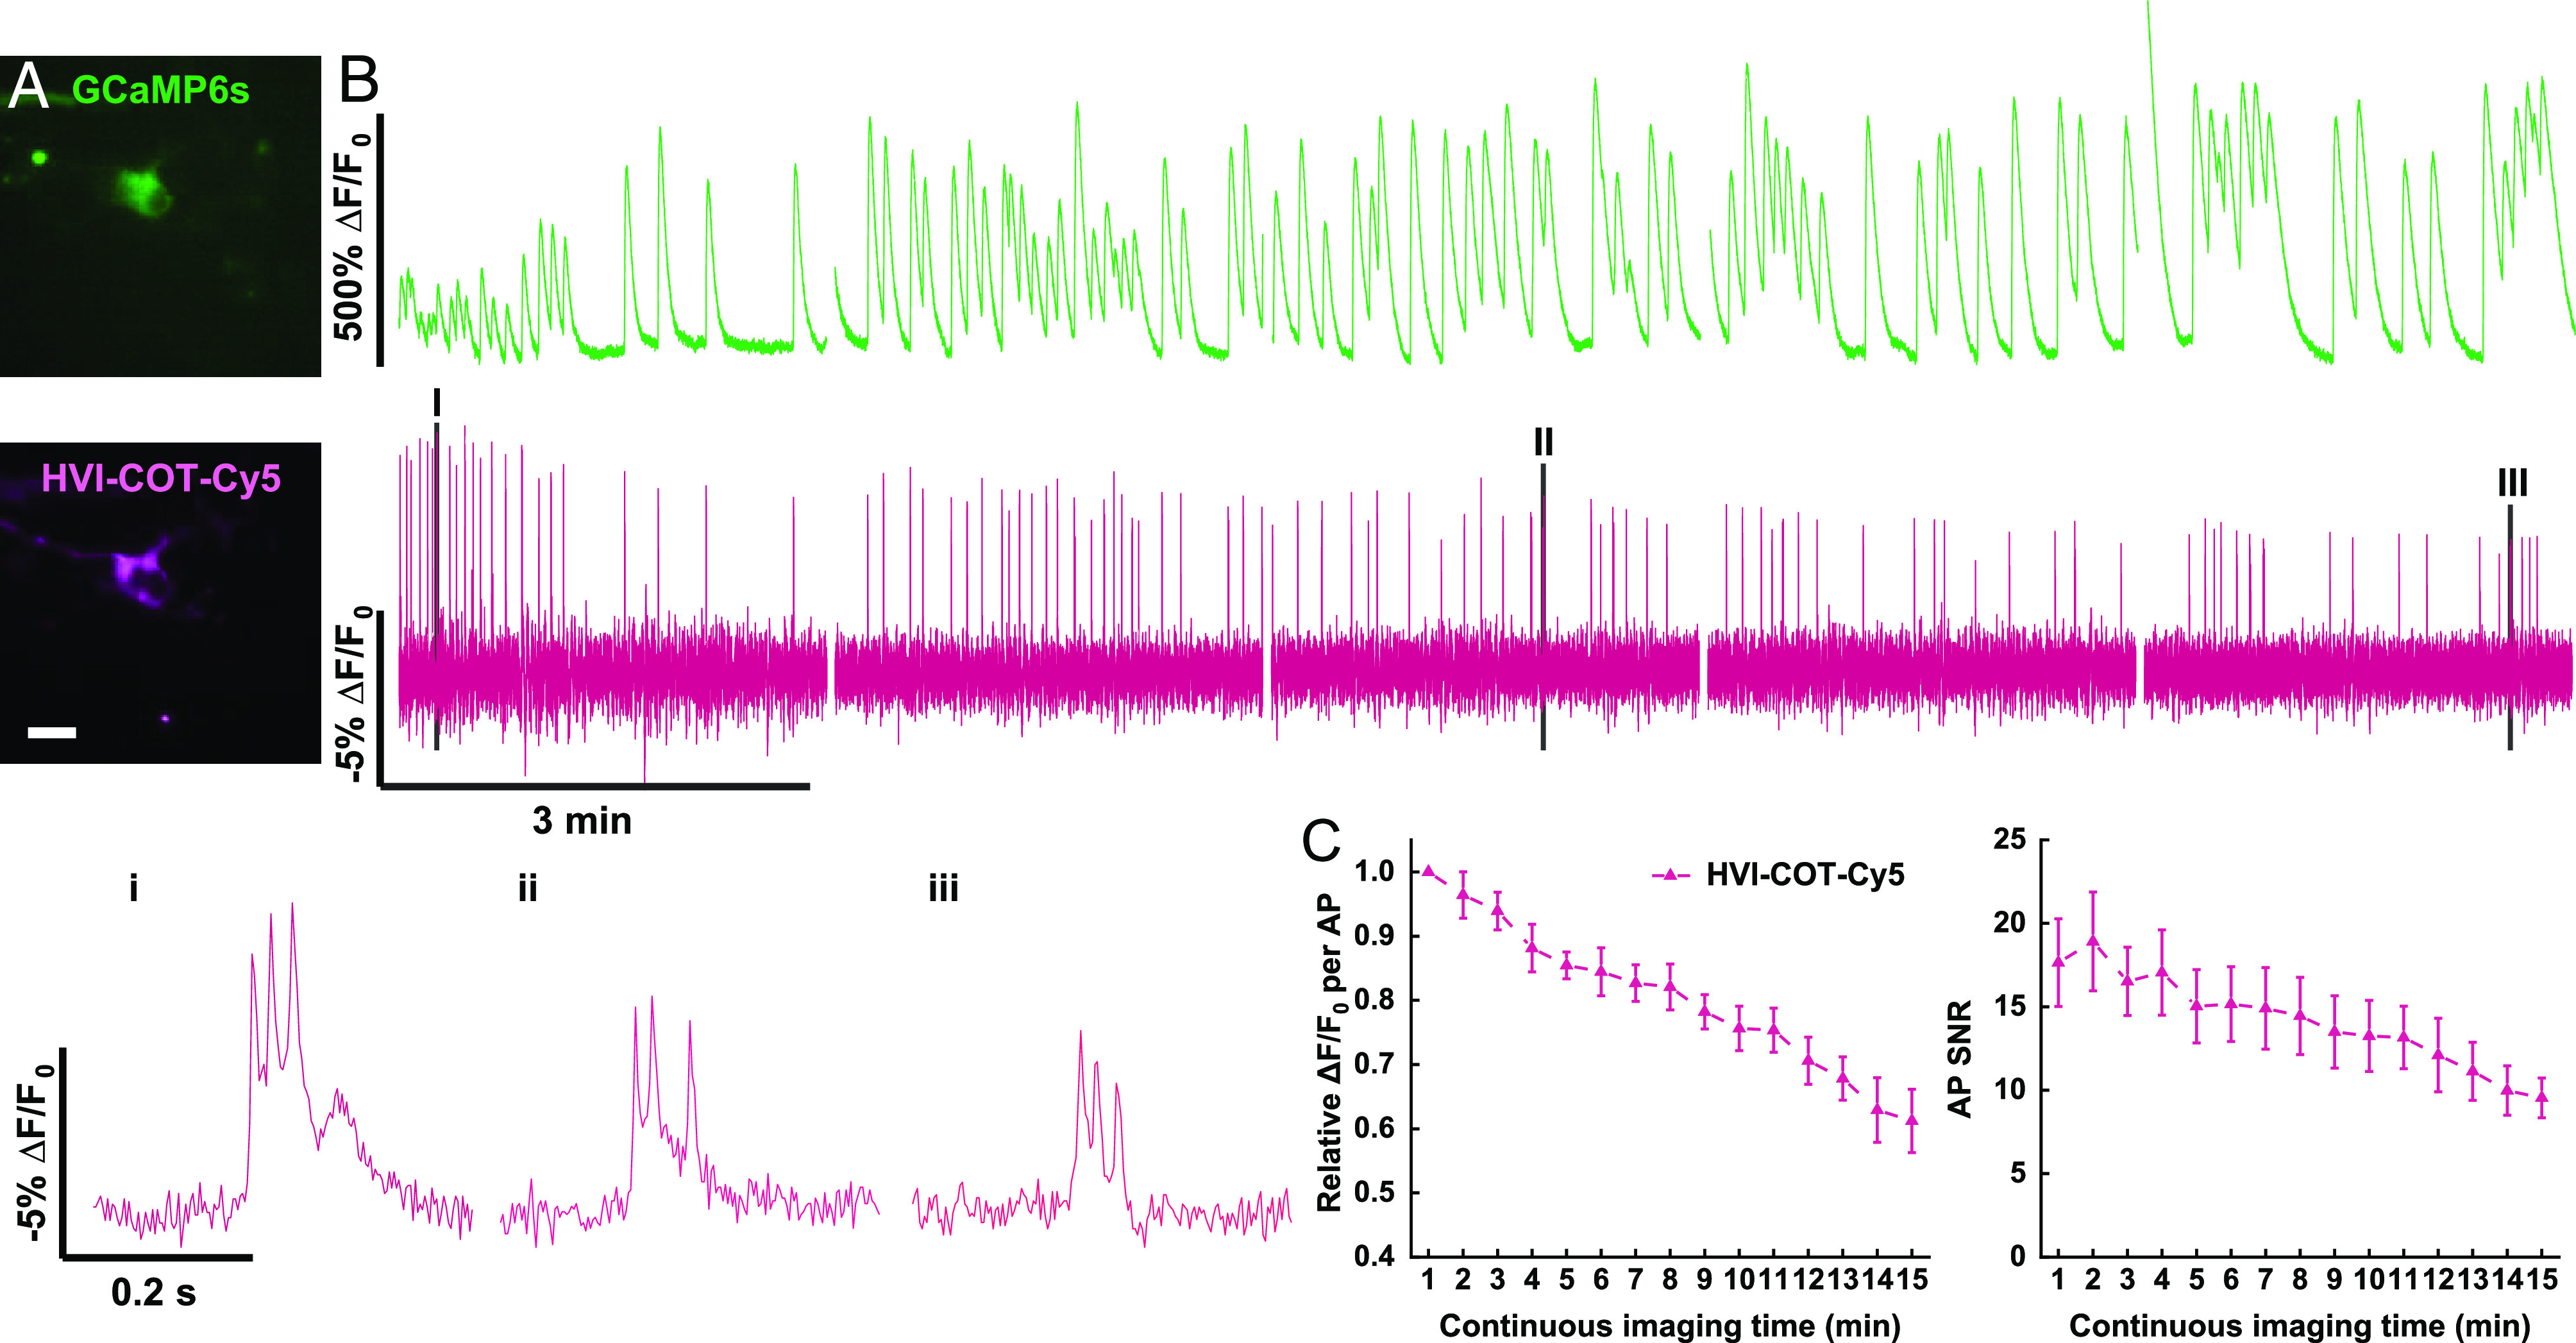
Fig. 3.

HVI–COT–Cy5 enables 15-min simultaneous imaging with GCaMP6s in neurons. (A) Wide-field imaging of neuron coexpressing GCaMP6s–NES and HVI–COT–Cy5. (Scale bar, 20 μm.) (B) Dual-color imaging of calcium (green, 40 Hz) and voltage (magenta, 400 Hz) in neurons for 15 min in total. The signal of HVI–COT–Cy5 was photobleaching corrected. Zoomed-in signals (i–iii) of shaded regions (I–III) were plotted at the bottom. The illumination intensities of 488 nm and 637 nm lasers were 0.2 W•cm−2 and 0.8 W•cm−2 individually. (C) Relative sensitivity (Left) and SNR (Right) of HVI–COT–Cy5 (n = 6 cells) as a function of continuous imaging time. Error bars represent SEM.
