Fig. 4.

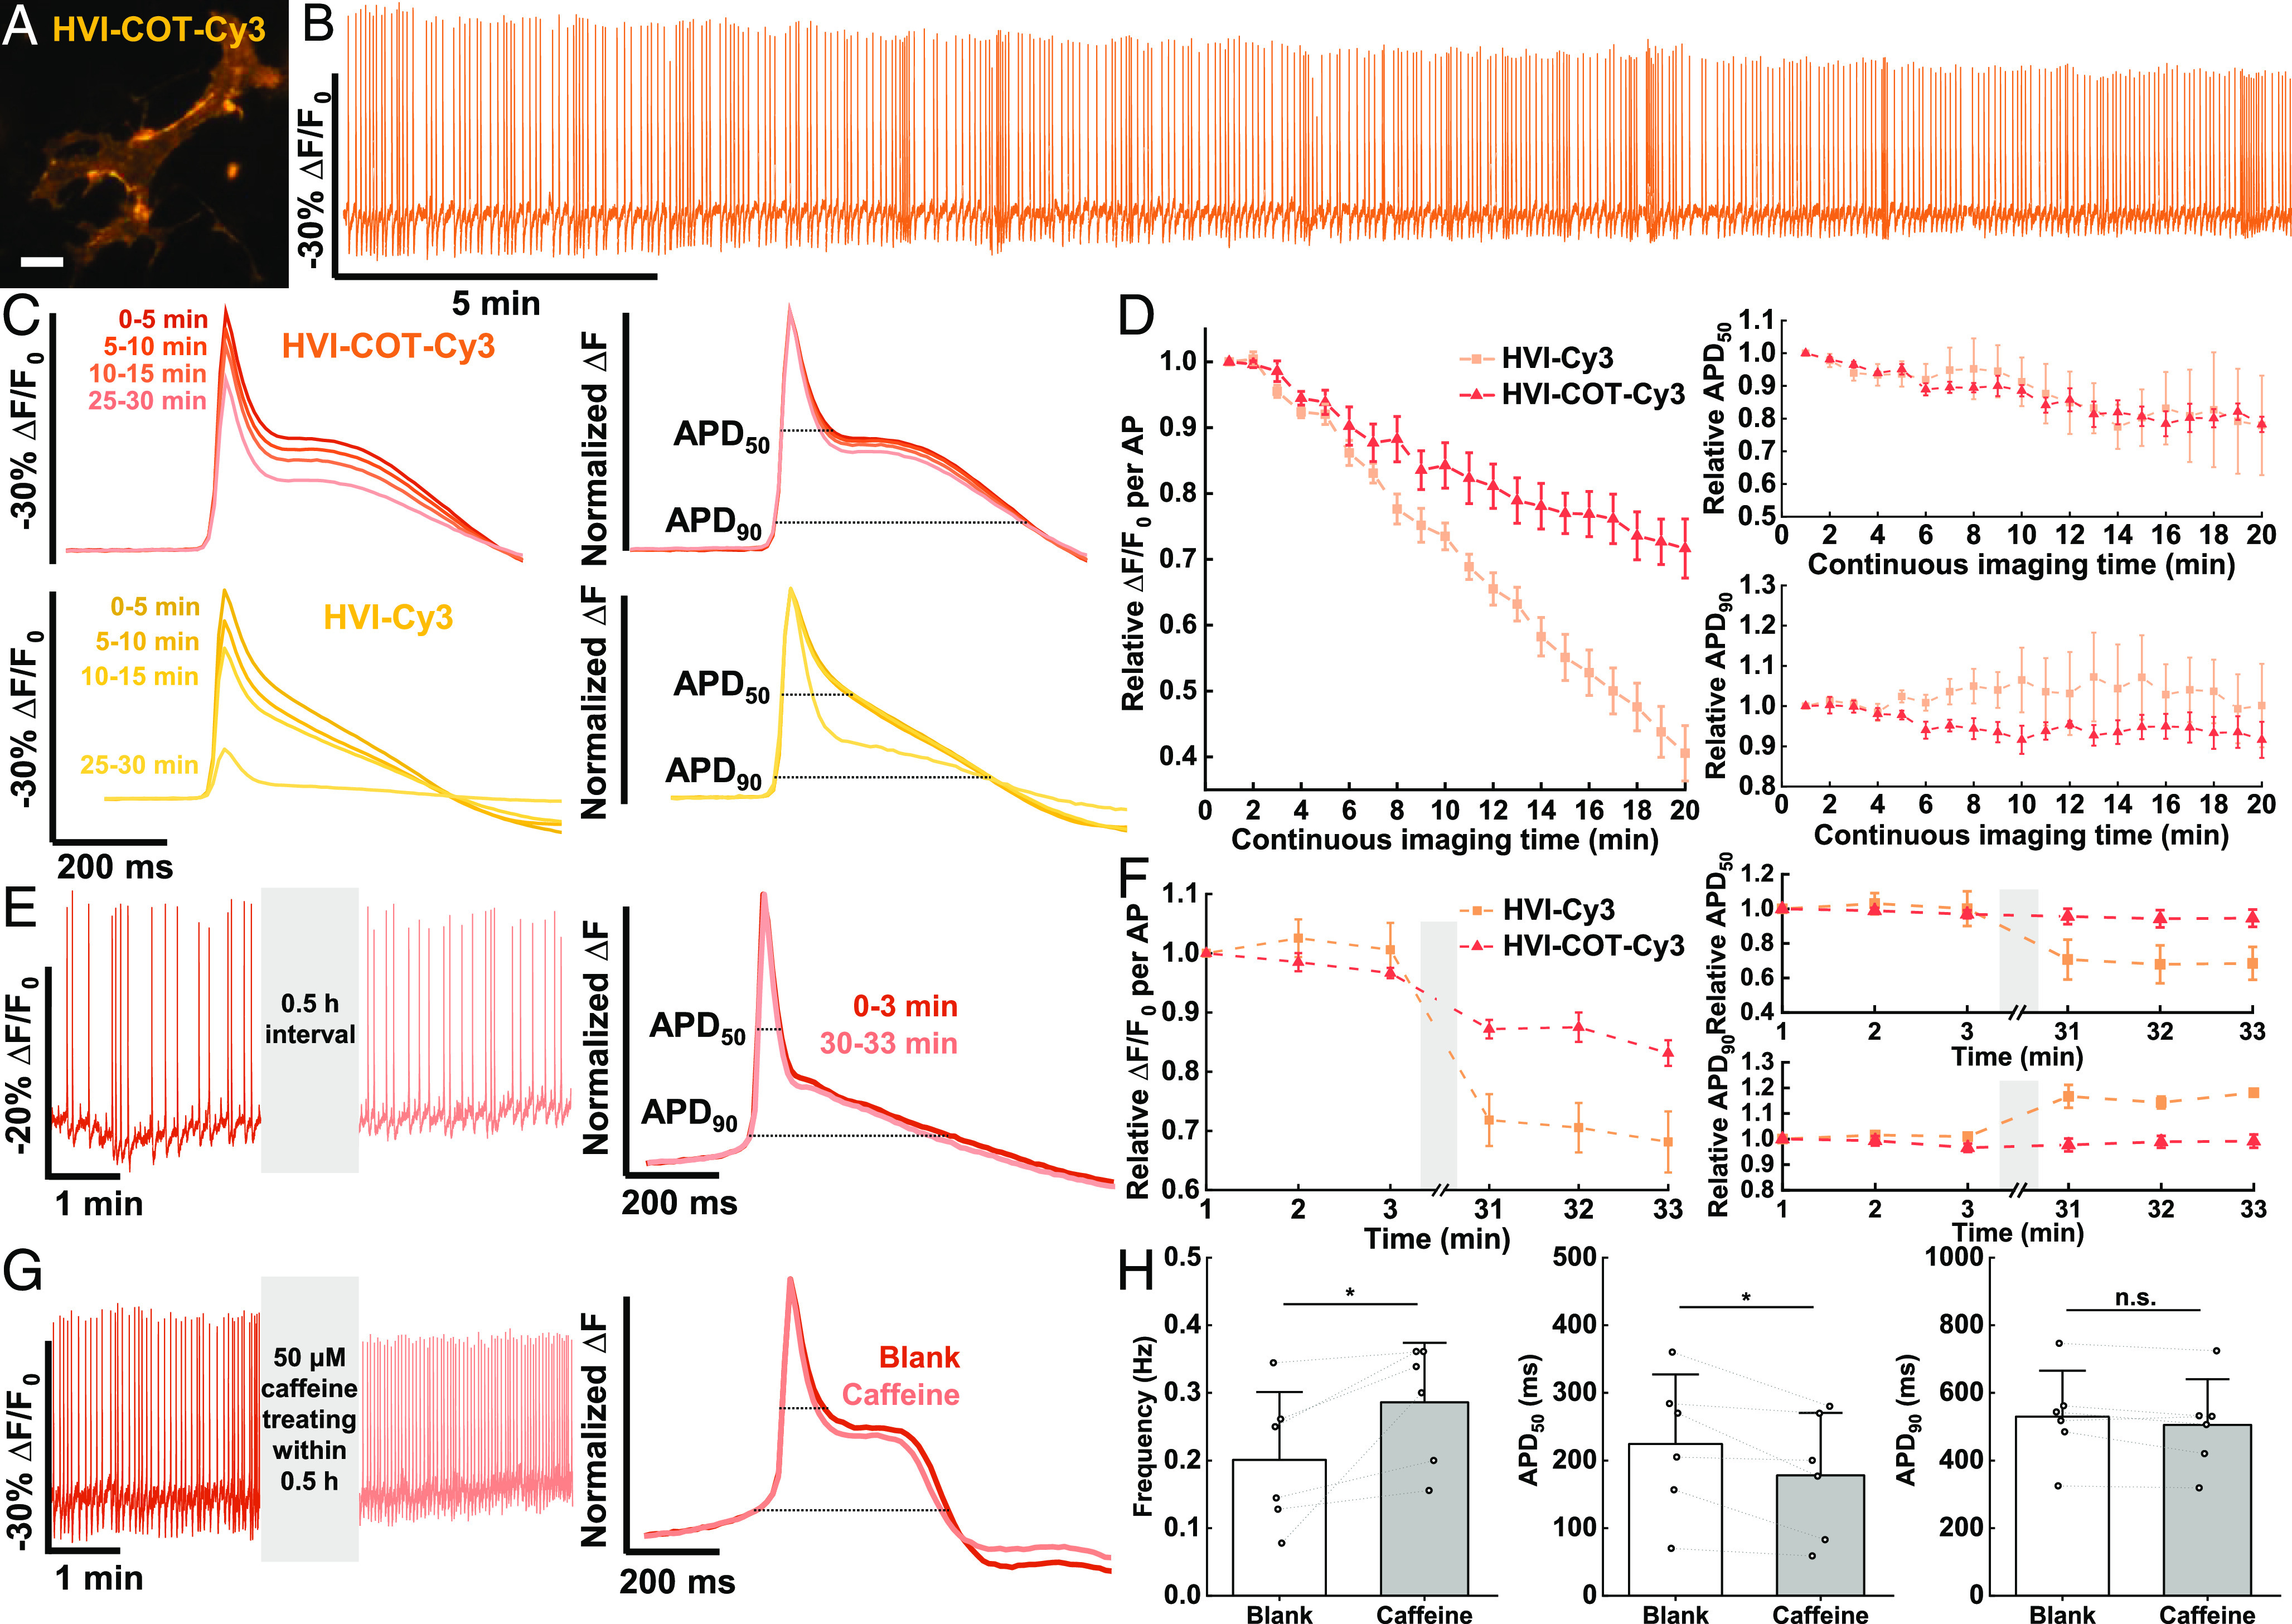
HVI–COT–Cy3 responds to cardiac AP with high fidelity. (A) Wide-field imaging of cardiomyocyte expressing HVI–COT–Cy3. (Scale bar, 20 μm.) (B) Six rounds of 5-min voltage imaging were performed successively for each cardiomyocyte. The signal of HVI–COT–Cy3 was photobleaching corrected. The illumination intensity of the 532 nm laser was 1.5 W•cm−2, and the camera frame rate was 100 Hz. (C) Overlays of the average AP signals (Left) and normalized average ΔF (Right) from four rounds of recording in B. (D) AP sensitivity, APD50, and APD90 of HVI–COT–Cy3 (n = 7 cells) and HVI–Cy3 (n = 8 cells) as a function of continuous imaging time. (E) Two rounds of 3-min imaging were performed with a 30-min interval. (F) AP sensitivity, APD50, and APD90 of HVI–COT–Cy3 (n = 9 cells) and HVI–Cy3 (n = 5 cells) as a function of time. Error bars represent SEM. (G) 50 μM caffeine was treated within 30-min interval. (H) Statistics of AP frequency, APD50, and APD90 from the recording of blank and caffeine treatment (n = 6 cells). Error bars represent SD. Statistical significances are determined by a two-sided paired t test (*P < 0.05; n.s., not significant).
