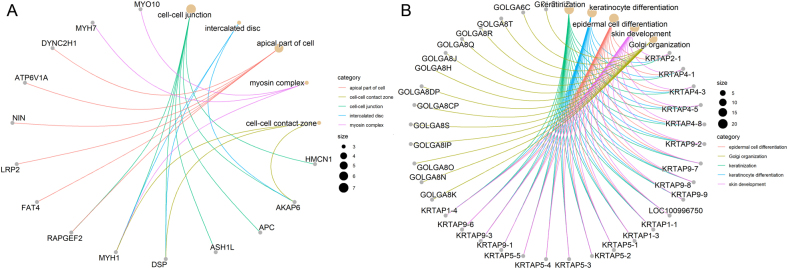
Figure 2.
The enriched function of frequently altered genes. Enriched functions of top altered genes with mutation rates of more than 16.7% (A) and genes with CNV rates of more than 44.4% (B) were shown. Functional enrichment was based on Gene Ontology (GO). Enriched functions and the corresponding matched genes were linked with specific colored lines. A full-colour version of this figure can be found at https://doi.org/10.1530/ERC-22-0257.

 This work is licensed under a