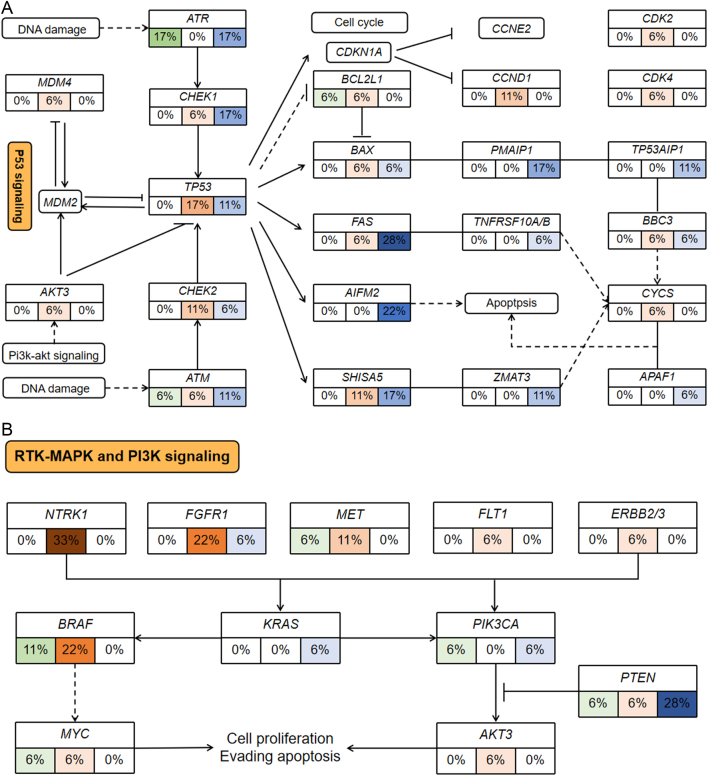
Figure 3.
Part of highly altered signaling pathways in R-NETs. The frequency of somatic mutations and copy number variations is shown for key genes in the P53 signaling pathway (A), MAPK, and PI3K-AKT signaling pathway (B). Different colors represent different gene alterations. Green represents mutation, red represents copy number amplification, and blue represents copy number deletion. The darker the color, the higher the frequency. A full-colour version of this figure can be found at https://doi.org/10.1530/ERC-22-0257.

 This work is licensed under a