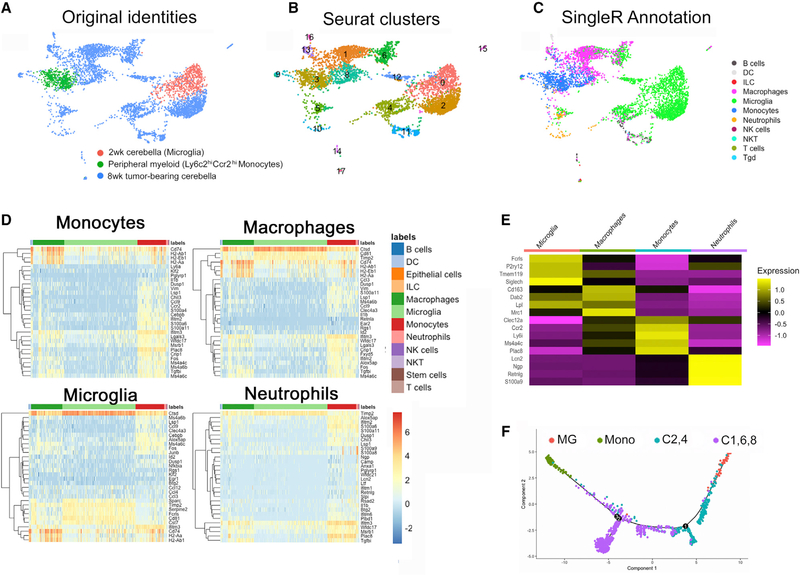
Figure 3. Single-cell RNA sequencing demonstrates myeloid heterogeneity in murine SHH-MB.
(A) UMAP plot colored by sample. Pink cells are Mic from 2-week Ptch1+/−Tp53−/− cerebella. Green cells are classical Mono from peripheral blood of same-age mice. Blue cells are from adult, tumor-bearing Ptch1+/−Tp53−/− mice.
(B) Seurat-based clustering of each subpopulation.
(C) SingleR annotation of subpopulations showing clusters 2 and 4 are microglia, clusters 8 and 1 are monocytes or macrophages, and cluster 6 comprises some cells most similar to macrophages and some cells more similar to microglia.
(D and E) Heatmap of the expression of the top 30 (D) and 4 select (E) genes of each reference label by myeloid cells in the test dataset, which are assigned that label to demonstrate confidence in the label assignment.
(F) Unbiased Monocle-based pseudotime analysis of the scRNA-seq data showing cells of clusters 2 and 4 are more similar to microglia (MG) and cells of clusters 1, 8, and 6 are more similar to monocytes (Mono).
See also Figures S1–S4.

