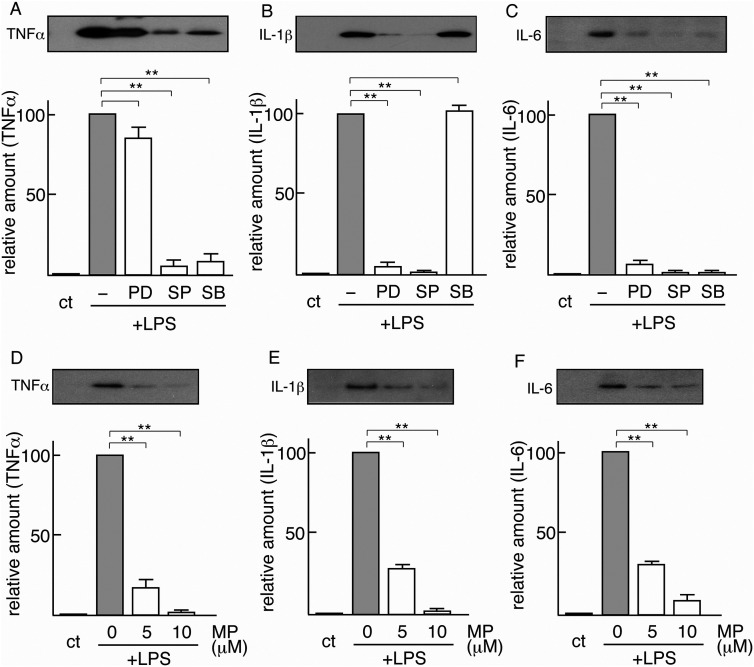
Figure 5.
Effects of MAPK inhibitors and protein kinase Cα inhibitor
A. B, C. Effects of MAPK inhibitors. Five microglial cultures were prepared, four of which were pretreated with vehicle (–), 20 μM PD98059 (PB), 20 μM SP600125 (SP), or 20 μM SB203580 (SB) for 1 h. These four microglia were then stimulated with LPS (0.5 μg/mL). The one remaining microglia was used as the control (ct). After 24 h, the medium of each culture was collected, concentrated, and freeze-dried as described in Material and methods. These samples were immunoblotted for TNFα (A), IL-1β (B), and IL-6 (C). The intensity of each inflammatory cytokine band in immunoblotting was quantified and is expressed as a value relative to that of microglia stimulated with LPS alone (defined as 100). The results are each the mean ± SD of three independent experiments. Differences between the inhibitor nonpretreated group (–) and the 20 μM inhibitor (PD, SP, SB)–pretreated groups were assessed by Student's t-test *P < 0.05, **P < 0.01.
D, E, F. Effects of PKCα. Four microglial cultures were prepared, three of which were pretreated with myristoylated pseudosubstrate (20–28) (MP) (0, 5, and 10 μM) for 1 h prior to LPS stimulation (0.5 μg/mL). The remaining microglial culture was used as the control (ct). These four cultures were maintained for 24 h, and each medium was recovered, concentrated, and freeze-dried. These samples were immunoblotted for TNFα (D), IL-1β (E), and IL-6 (F). The intensity of each inflammatory cytokine band in immunoblotting was quantified and is expressed as a value relative to that of microglia stimulated with LPS alone (defined as 100). The results are each the mean ± SD of three independent experiments. Differences between the inhibitor nonpretreated group (0 μM MP) and the inhibitor (5 μM, 10 μM)–pretreated groups were assessed by Student's t-test *P < 0.05, **P < 0.01.

