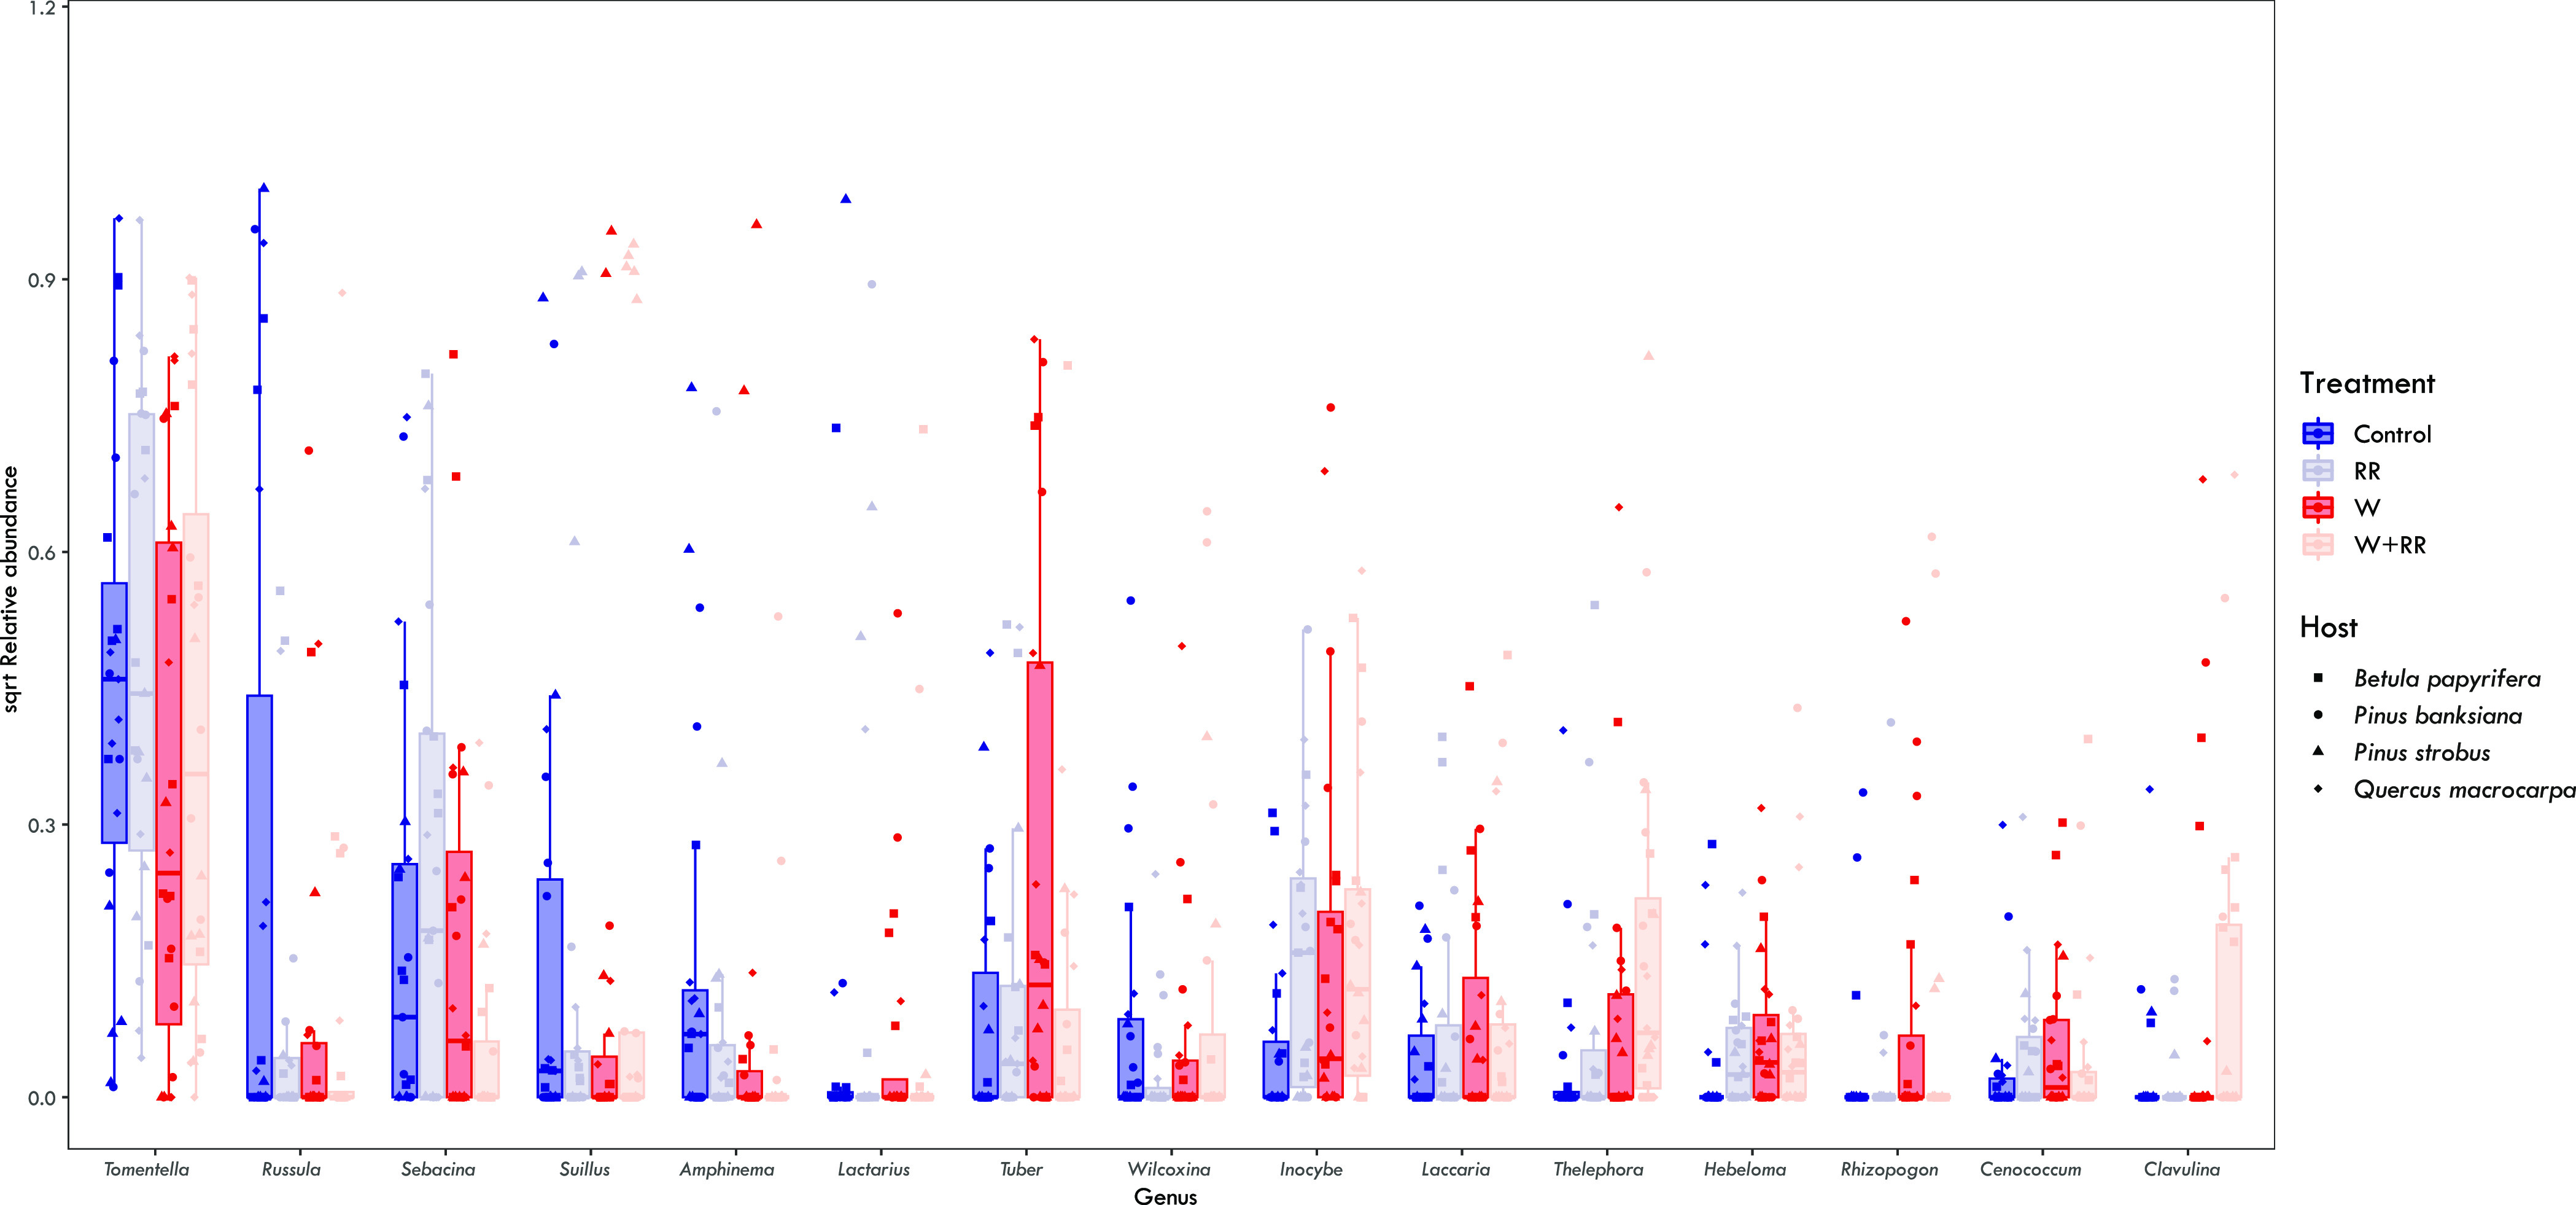
Fig. 1.

The relative abundances (data are square-root transformed) of top 15 ectomycorrhizal fungal genera across the warming and reduced rainfall treatments. Boxplots represent the median (line in box), 25 percentile (lower hinge) and 75 percentile (upper hinge) ranges, and whiskers represent the range. Points represent the relative abundance of each genus per sample (N = 94) and are color coded by treatment and shape is coded to each host species.
