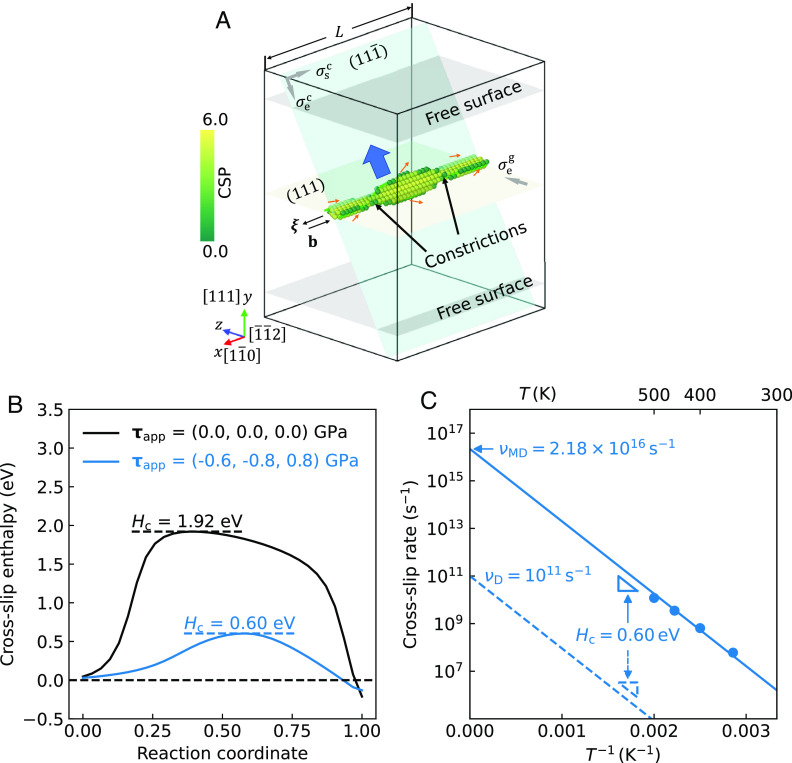
Fig. 1.
Discrepancy between MD rates and TST predictions. (A) Simulation cell () with a screw dislocation along the -direction, visualized by OVITO (26). Atoms are colored according to their centrosymmetric parameter (CSP), given an fcc crystal structure (12 neighbors). The atoms with are extracted to visualize the dislocation core structure. The screw dislocation changes the slip plane from to following the Freidel–Escaig mechanism (27). The three Escaig–Schmid stresses components controlling the cross-slip process are applied on the two slip planes. The cross-slipped dislocation moves along the cross-slip plane (blue arrow) if is applied and finally annihilates at the free surface. (B) Converged minimum-energy paths of cross-slip, calculated at zero stress and fixed applied stress . The positive directions of the shear stresses are marked as arrows in A. (C) Cross-slip rates at different temperatures obtained by MD simulations (solid line) and predicted by TST Eq. 1 (dashed line) under fixed applied stress .

