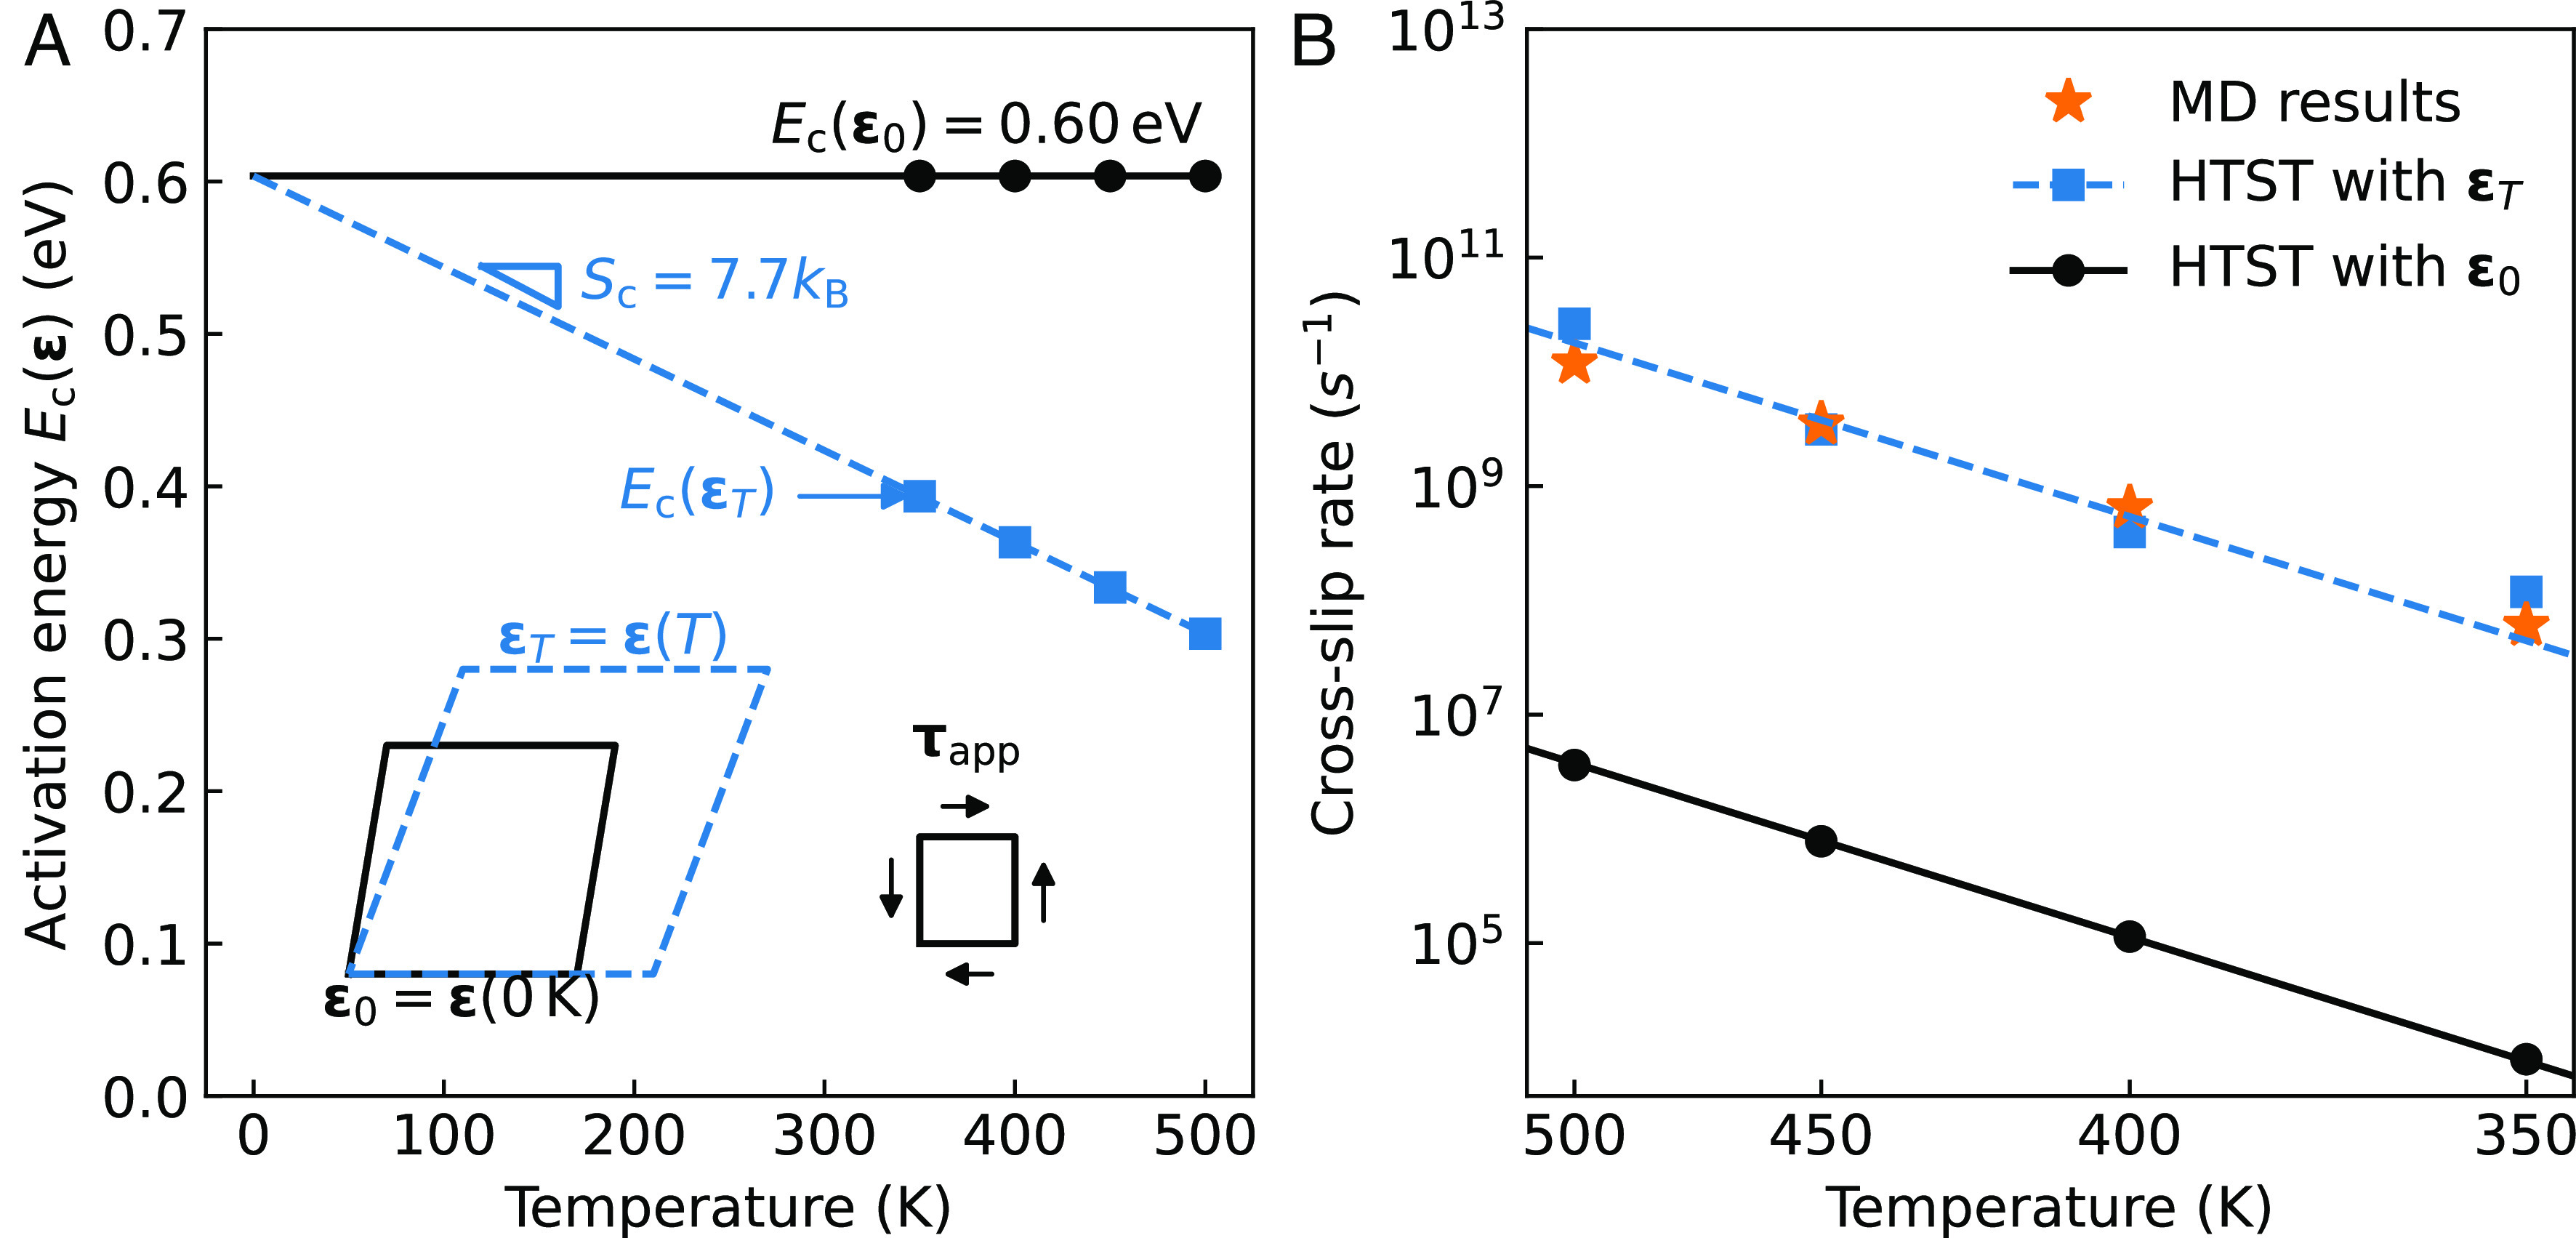
Fig. 2.

Activation entropy due to the thermal strain. (A) Activated energy calculated at zero-temperature strain and corresponding finite-temperature strain . The inset diagram schematically shows the thermal strain caused by temperature increase with the same applied stress . (B) Estimated rates using HTST (Eq. 4) with the activation energy and prefactor evaluated at and . The benchmark average MD rates are shown as the stars (see SI Appendix, Text VII for the statistical analysis of the MD simulations).
