Figure 1.
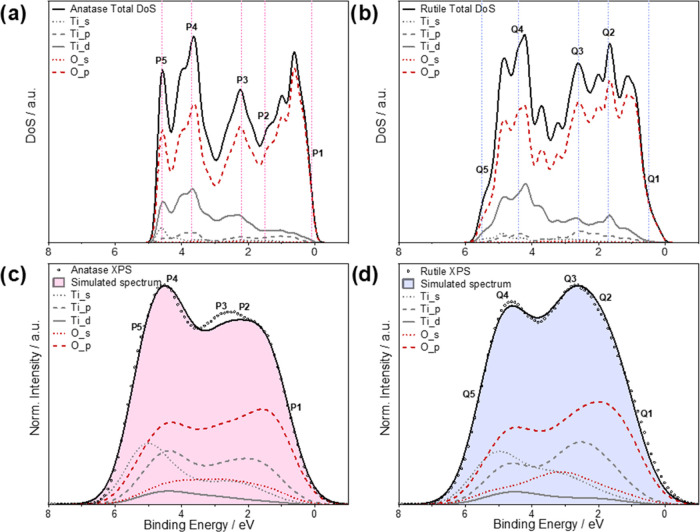
Partial DoS (pDoS) for (a) anatase and (b) rutile phases of TiO2, calculated within the DFT framework. A small degree of Gaussian broadening (0.1 eV) was applied to help visualize the data. The simulated VB spectra of (c) anatase and (d) rutile decomposed into their different angular momentum components and scaled to equal heights of the overlaid XPS spectra. The simulated spectra were derived from the pDoS by correction with several refined parameters (see Experimental and Computaional Methods section) photoionization cross-section values and Gaussian (1.3 eV) and Lorentzian (0.1 eV) broadening. The experimental spectra were smoothed using a 3-point moving average filter and have been corrected via Shirley background subtraction. The experimental valence band maximum has been aligned to 0 eV, and the simulated spectra have been aligned with the experimental using a least-squares fitting method. The regions labeled P1–5 and Q1–5 indicate regions of interest and are discussed in the text. The positions relative to the DFT energy scale are: P1, 0.1; P2, 1.5; P3, 2.2; P4, 3.7; P5, 4.6 eV and rutile: Q1, 0.5; Q2, 1.7; Q3, 2.6; Q4, 4.4; and Q5, 5.5 eV.

