Figure 2.
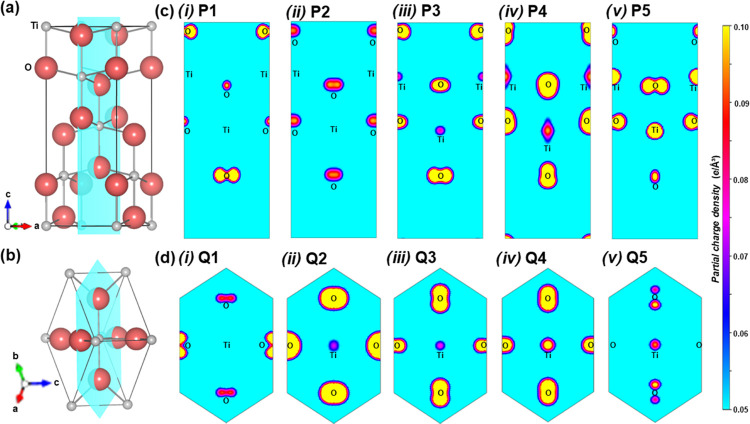
Contributions to the electron density at characteristic features in the VB spectra can be visualized by contour plots of the partial charge density. Lattice planes cutting through the central TiO6 octahedra in the unit cell are shown for (a) anatase and (b) rutile, which bisects the central Ti atom (gray spheres), both axial and two equatorial oxygen atoms (red spheres). These were used to obtain partial charge densities for states between selected small energy intervals in (c) anatase: (i) P1, (ii) P2, (iii) P3, (iv) P4, and (v) P5 and in (d) rutile: (i) Q1, (ii) Q2, (iii) Q3, (iv) Q4, and (v) Q5. The range of isosurface values is set to 0.05–0.10 e/Å3 in each plot.

