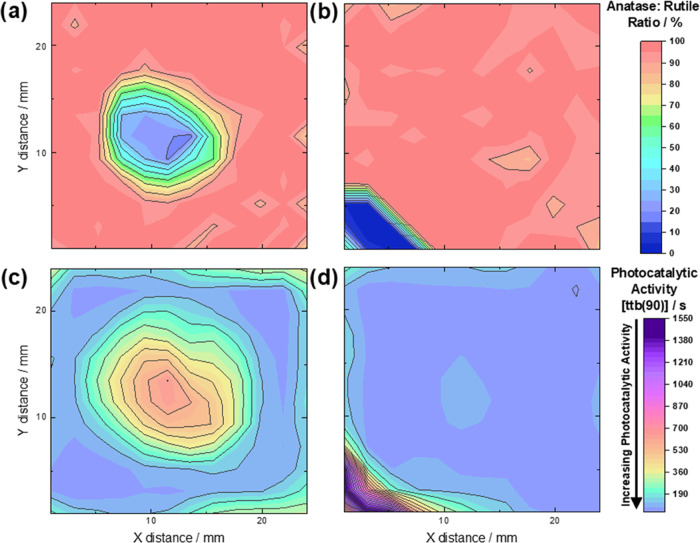
Figure 4.
(a,b) Composition maps showing the anatase:rutile surface phase fraction across mixed-phase TiO2 samples as determined using a fitting model derived from DFT-simulated spectra. (c, d) The DFT fitting model successfully identifies the rutile-rich regions, which are evidenced by photocatalytic activity maps following the reduction of resazurin ink. The time to bleach ttb(90) is the time taken for 90% of the transformation in ink to occur in seconds.

