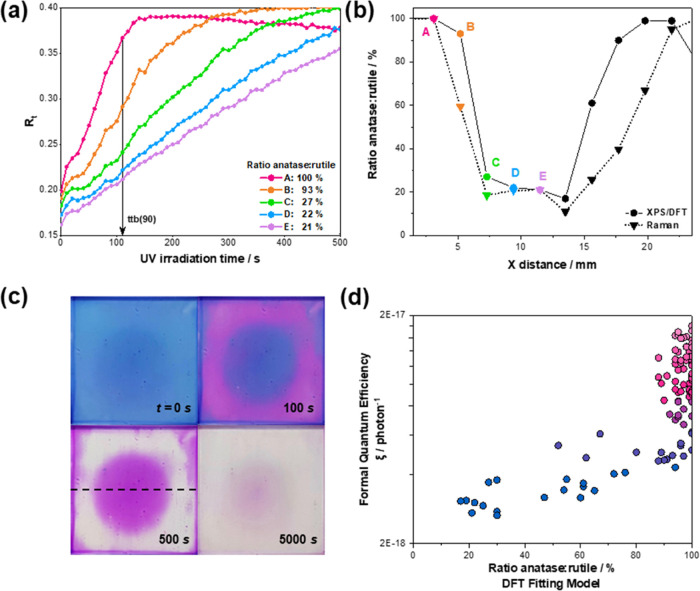
Figure 5.
(a) Normalized red components (Rt) of the resazurin dye upon irradiation time over the r-center sample. (b) The corresponding percentages of surface anatase as determined by the DFT fitting model are indicated and refer to the points labeled (A–E). (b) The compositions are estimated by the DFT fitting model and by Raman analysis for a linear cross-section of the r-center film, which is indicated by the dotted line in (c). (c) Photographic images of the dye-coated r-center film after exposure to UV irradiation showing the slower transformation of the resazurin dye in the rutile-rich center. Irradiation time in seconds is indicated for each photograph. (d) Variation of local formal quantum efficiencies, ξ (units, photon–1), defined here as the Rz photoreduction rate of per incident photon, with the local phase fraction of anatase predicted by the DFT-simulated fitting model. The ξ values are plotted on a log scale. Color mapping of the points is based on the anatase:rutile ratio.

