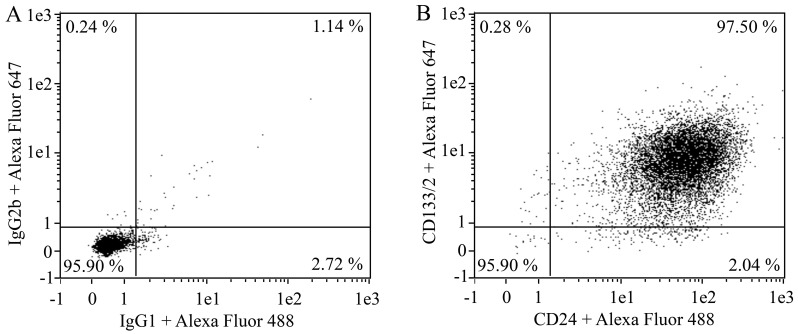
Figure 1. Evaluation of CD133/2 and CD24 expression in kidney progenitor cells by flow cytometry.
Representative flow cytometry dot plot graphs showing the percentage of CD133 and CD24 positive cells in primary kidney progenitor cells at passage P1 (B). Staining of the same cells with isotype control antibodies is shown in (A).

