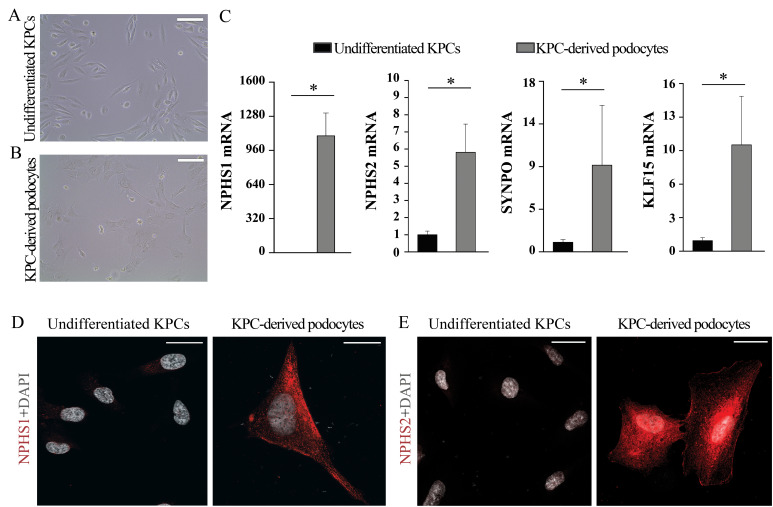
Figure 2. Evaluation of podocytes derived from kidney progenitor cells.
Representative phase contrast images of (A) undifferentiated kidney progenitor cells and (B) podocytes derived from kidney progenitor cells after 48 h of differentiation. Scale bars, 100 μm. (C) qRT-PCR assay of the podocyte markers NPHS1, NPHS2, KLF15, and SYNPO in undifferentiated kidney progenitor cells and in podocytes derived from kidney progenitor cells. mRNA expression of the podocytes markers was determined by qRT-PCR and reported as mean ± SEM of fold increase over undifferentiated cells. (D, E) Representative confocal microscopy images showing expression of the podocyte markers NPHS1 and NPHS2 (red) in undifferentiated kidney progenitor cells and in podocytes derived from kidney progenitor cells. DAPI (white) was used to counterstain nuclei. Scale bars, 25 μm. KPC, kidney progenitor cell.

