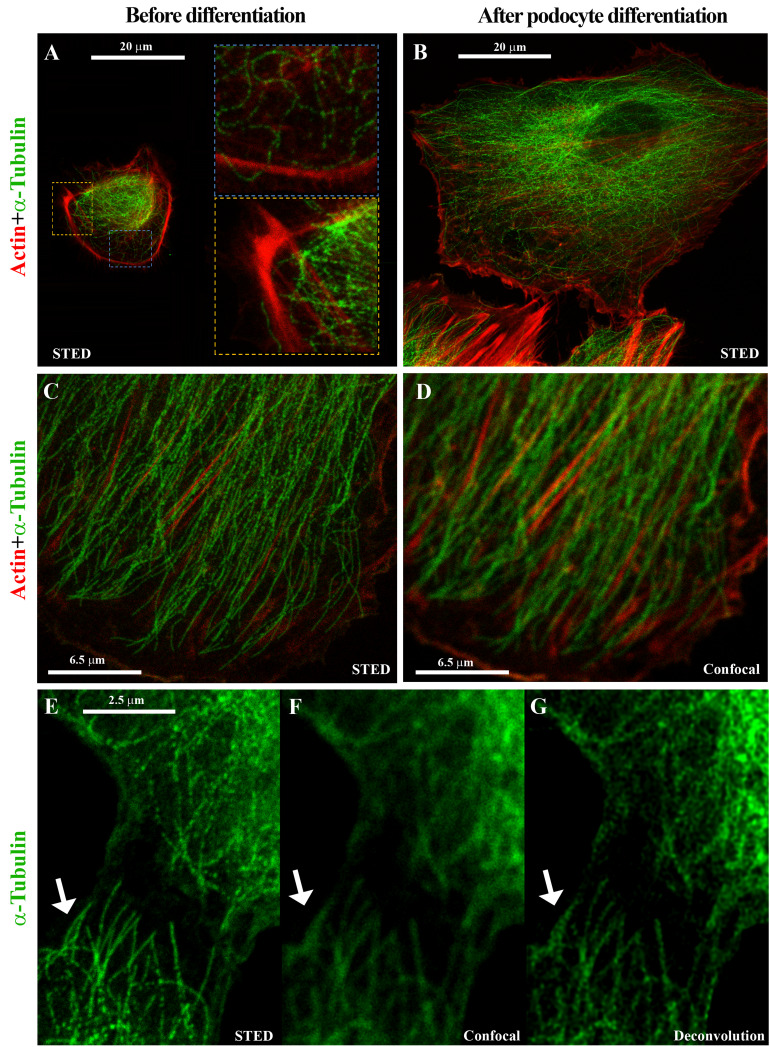
Figure 3. Stimulated emission depletion (STED) super-resolution microscopy shows cytoskeleton changes associated with differentiation.
Representative STED images showing cytoskeleton changes associated with differentiation into podocytes based on α-Tubulin (green) and Actin (red) expression in primary human kidney progenitor cells before (A) and after 48 h differentiation (B–G). Compared to confocal microscopy (D, F), the use of STED microscopy and deconvolution software allows to identify the cytoskeleton organization with nanoscopic spatial resolution (C, E, and G).

