
Fig. 2.
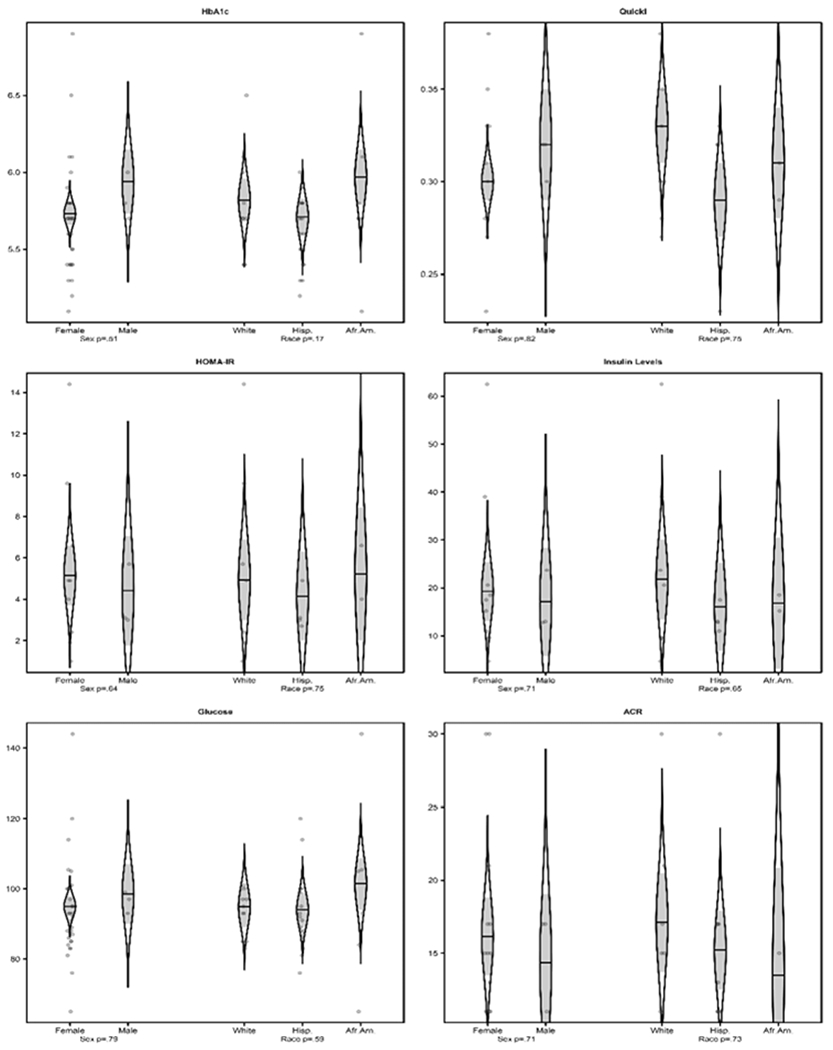
Associations between HbA1c, QUICKI, HOMA-IR, fasting insulin levels, fasting glucose, and ACR FM scores (central pain scores) with gender and ethnicity. Predictions from analysis of variance models are shown as catseye plots (22, 23) which illustrate the normal distribution of the model-adjusted means with shaded +/− standard error intervals, together with scatter plots of the raw measures (randomly jittered horizontally for clarity), and with F-test P-values of associations with gender and ethnicity. There was no significant evidence of an association between the abnormalities discovered with gender or ethnicity.