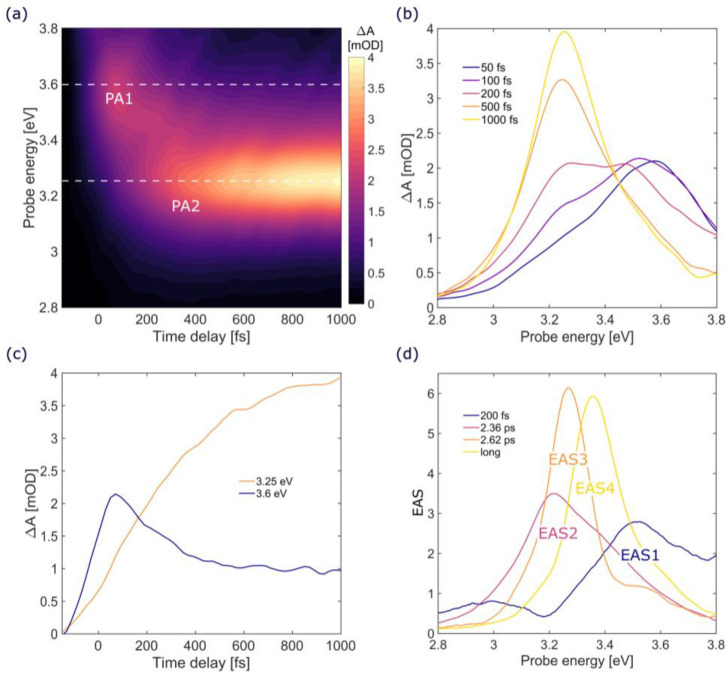
Figure 2.
(a–c) TA data of HC12H in the first picosecond after excitation (pump at 4.54 eV): (a) TA map as a function of delay and probe photon energy; (b) TA spectra at selected pump–probe delays (from 50 fs to 1 ps); (c) TA dynamics at selected probe photon energies, corresponding to the two PA bands (PA1 blue line and PA2 orange line); (d) EAS obtained from the global analysis of the TA data, with the corresponding time constants.

