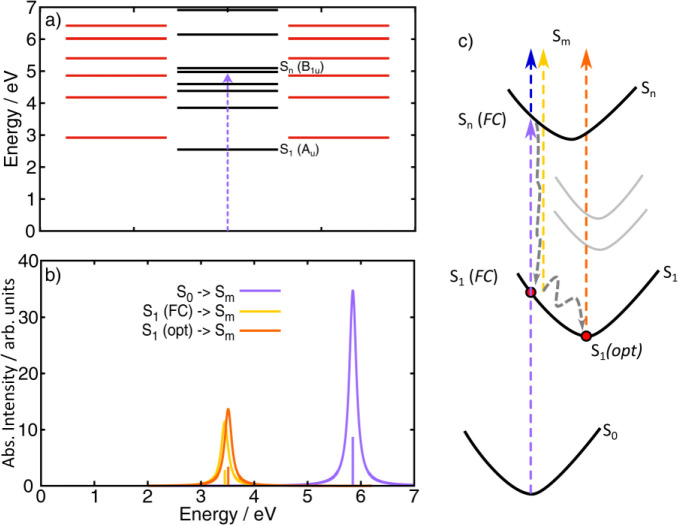
Figure 4.
(a) Computed TD-DFT (B2PLYP/def2-TZVP) vertical excited state energies of singlet states; red lines show degenerate dark (i.e., symmetry forbidden) excited states, while black lines refer to not degenerate excited states; Sn is the dipole-allowed (B1u) excited state (violet arrow represents the transition from the ground state), while S1 is the first (low-lying) dark (symmetry forbidden, Au) state. (b) Computed TDA (ωB97X-D3BJ/def2-TZVP) electronic transitions and spectra for the S0 → Sm transitions (ground to high-lying excited states) (violet line), the S1 → Sm transitions (transient absorption excited-to-excited states) as evaluated at the FC region (i.e., ground state S0 geometry) (orange line), and the S1 → Sm transitions as calculated at the relaxed (optimized, opt) S1 geometry (dark yellow line); spectra are computed as Lorentzian function centered around the calculated TDA transitions; TDA energies are not scaled. (c) Scheme of the photoinduced relaxation mechanisms involving S0, Sn, and S1 states; gray arrows sketch the IC from Sn to S1 (FC region) being the first ultrafast process and the cooling mechanisms within the S1 state. Violet arrow indicates the ground state photoexcitation, blue arrow indicates the PA1 transition, and dark yellow and orange arrows indicate the hot and relaxed PA2 transitions, respectively. The experimental energy blue-shift of PA2 (Figure 3) is supported by the computed yellow and orange TA spectra (panel b) and sketched by the corresponding arrows (panel c).

