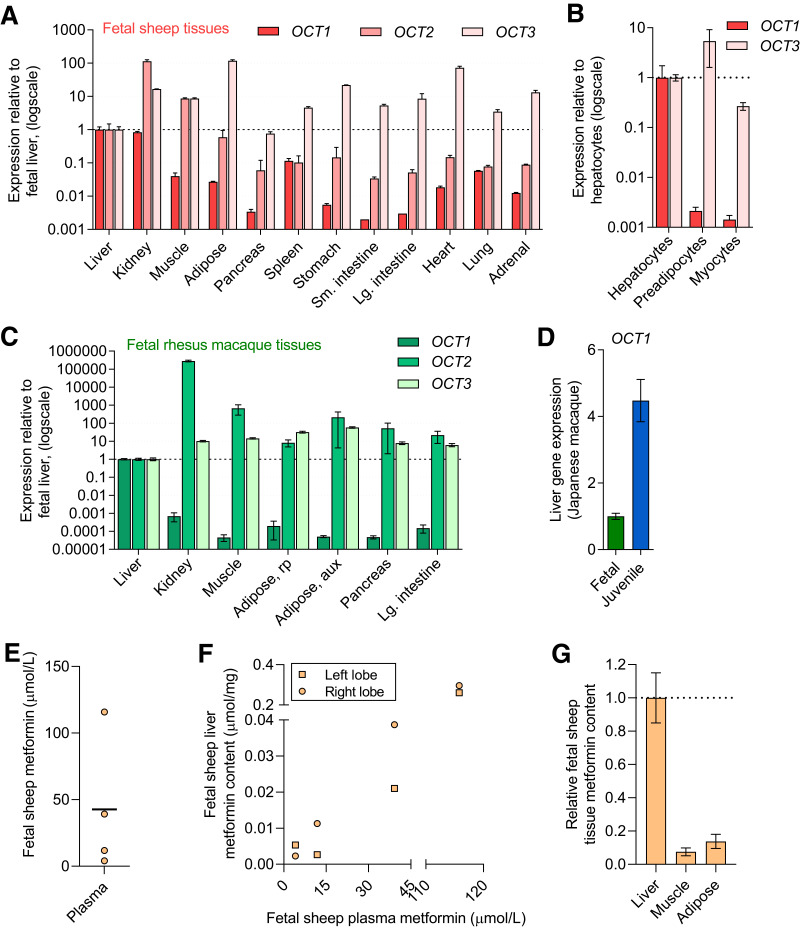
Figure 1.
Expression of metformin transporters and metformin uptake in fetal tissue. OCT1, OCT2, and OCT3 gene expression in fetal sheep tissue (tissues from two fetuses) (A) and primary cells (from four fetuses) (B). OCT1, OCT2, and OCT3 gene expression in fetal primate (rhesus macaque) tissue (from eight fetuses) (C). OCT1 expression in fetal (n = 4, Japanese macaque) compared with juvenile primate (n = 8, Japanese macaque) liver tissue (D). Results for each transporter are shown relative to expression in the liver or hepatocyte and on a log scale. Metformin plasma concentrations (mean and individual values) in fetal sheep following metformin infusion (n = 4) (E). Relationship between metformin concentration in plasma and liver following metformin infusion in fetal sheep (F). Relative metformin content in fetal sheep tissue following metformin infusion (G). Means ± SE are shown.

