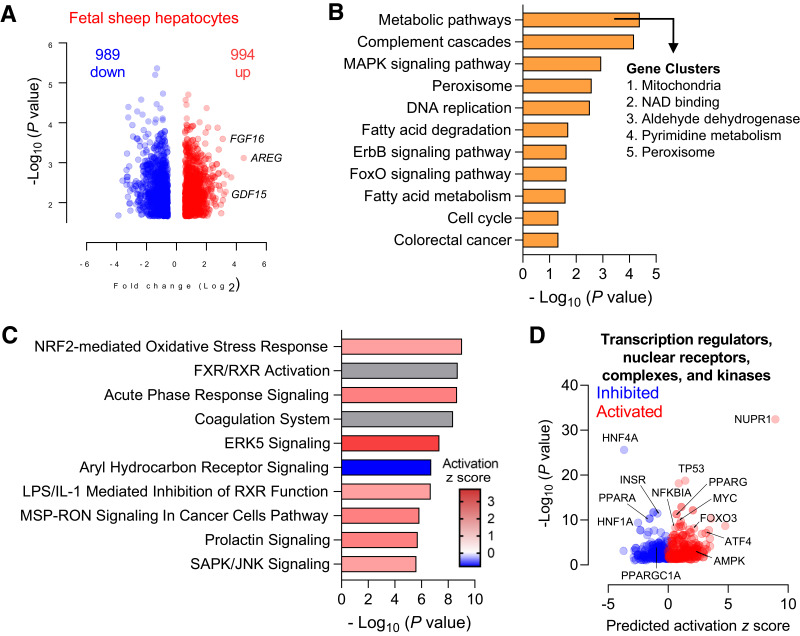
Figure 4.
Global transcriptomics in fetal hepatocytes exposed to metformin. Fetal sheep hepatocytes were incubated with 0 μmol/L metformin (basal) or 1,000 μmol/L metformin for 24 h (n = 4). Volcano plot analysis with a false discovery rate–adjusted q value of <0.05 and absolute fold change of >1.5 (A). KEGG analysis of pathways enriched in the set of DEGs following treatment with metformin was performed using DAVID. Gene clusters within the “metabolic pathway” term were identified using the cluster analysis tool for functional annotation terms in DAVID (B). Canonical pathway enrichment of the DEGs was performed using IPA (C). Volcano plot of predicted upstream regulators from IPA with predicted activation z score and P value indicated. Relevant factors are indicated as shown (D).

