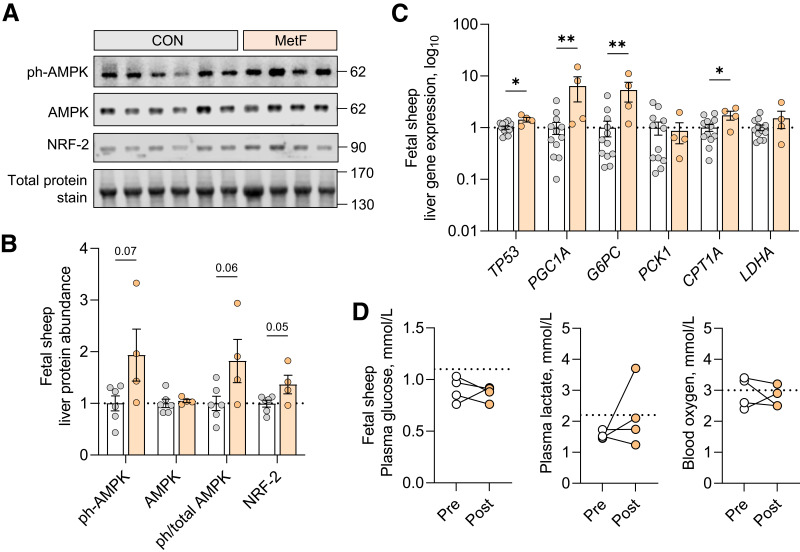
Figure 7.
Fetal hepatic response to fetal metformin infusion. Liver tissue from fetal sheep receiving metformin infusions (MetF, n = 4, colored bars) was compared with samples from fetal sheep without infusions (CON, n = 6–12, as shown, white bars). AMPK protein phosphorylation (T172) and total abundance of AMPK and NRF-2 was measured using Western blot analysis. Western blot images are shown. To demonstrate equality of loading, a section of blot showing total protein staining between 130 and 170 kDa is shown (A). Quantification of protein abundance and ratios of phosphorylated to total protein for AMPK are shown (B). Expression of regulatory and metabolic genes was measured (C). Plasma glucose, plasma lactate, and blood oxygen content were measured before (open circles) and at the end of (filled circles) metformin infusion, with connected lines representing samples from the same fetus. Dashed lines represent values expected from normal fetal sheep as reported (30,32,38) (D). Means ± SE are shown. *P < 0.05 and **P < 0.01 in MetF compared with CON.

