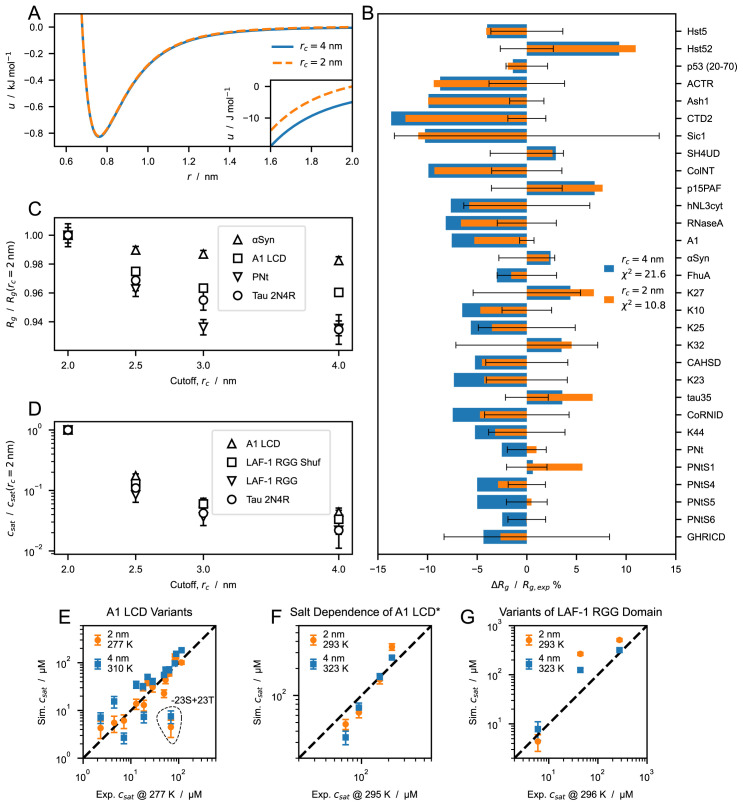
Figure 3. Effect of cutoff size on predictions of radii of gyration, R g , and saturation concentration, c sat , from simulations performed using the CALVADOS 1 parameters.
( A ) Nonionic Ashbaugh-Hatch potentials between two W residues with cutoff, r c , of 4 (blue solid line) and 2 nm (orange dashed line). The inset highlights differences between the potentials for rs ≤ r ≤ rc. ( B ) Relative difference between experimental and predicted radii of gyration, 〈 R g 〉, for r c = 4 (blue) and 2 nm (orange). values reported in the legend are calculated for all the sequences in Table 1. Error bars represent the experimental error relative to . ( C ) 〈 R g 〉 of α-Synuclein, hnRNPA1 LCD, PNt and human full-length tau ( Table 1 and Table 2) from simulations performed with increasing cutoff size, r c , and normalized by the value at r c = 2 nm. ( D ) Saturation concentration, c sat , for hnRNPA1 LCD, the randomly shuffled sequence of LAF-1 RGG domain, LAF-1 RGG domain and human full-length tau for increasing values of r c and normalized by the c sat at r c = 2 nm. ( E– G ) Correlation between c sat from simulations and experiments for ( E ) A1 LCD variants, ( F ) A1 LCD ∗ WT at [NaCl] = 0 .15, 0.2, 0.3 and 0.5 M and ( G ) variants of LAF-1 RGG domain ( Table 4).

