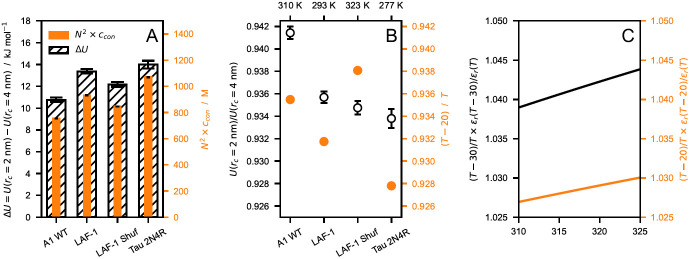
Figure 4.
( A ) Comparison between nonionic energy difference per protein (∆ U = U ( r c = 2 nm) − U ( r c = 4 nm), hatched) and N 2 × c con (orange), where N is the sequence length and c con is the molar protein concentration in the condensate. ( B ) Ratio between nonionic energies calculated with r c = 2 and 4 nm (open circles) compared to the ratio of the thermal energy, , at T′ = T − 20 K and at T (orange), where R is the gas constant. ( C ) Increase in electrostatic energy relative to the thermal energy upon decreasing the temperature by 30 (black) and 20 K (orange). The data shown in this figure are obtained from simulations of hnRNPA1 LCD, LAF-1 RGG domain (WT and shuffled sequence) and Tau 2N4R performed at T = 310, 293, 323, and 277 K, respectively, and using r c = 4 nm. Error bars are standard deviations over trajectories of the systems at equilibrium.

