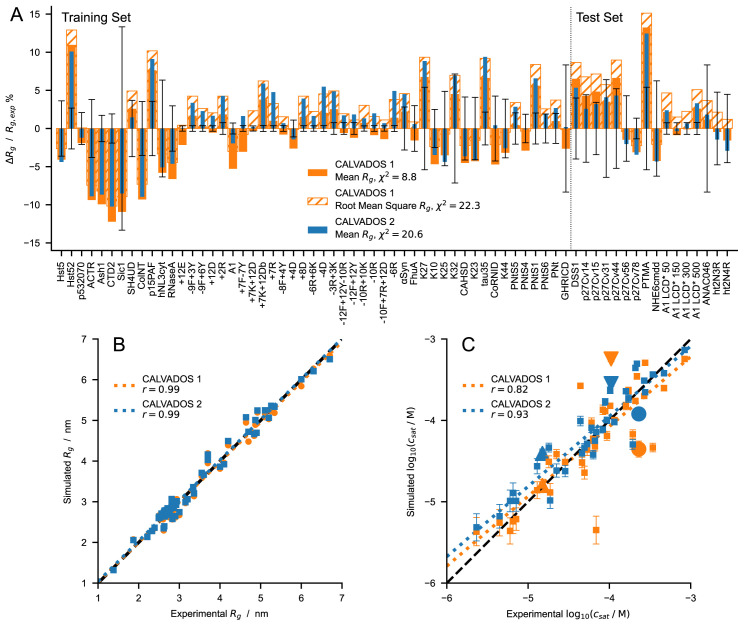
Figure 7.
( A ) Relative difference between experimental and predicted radii of gyration for CALVADOS 1 (orange) and CALVADOS 2 (blue). Full and hatched bars show ( – )/ where is calculated as the mean or the root mean square , respectively. The vertical dashed line splits the plot into the 51 and 16 sequences or solution conditions of the training set ( Table 1) and test set ( Table 2), respectively. Error bars represent the experimental error relative to . χ 2 values in the legend are averages over 67 different sequences or solution conditions ( Table 1 and Table 2). ( B and C ) Comparison between experimental and predicted ( B ) R g ( Table 1 and Table 2) and ( C ) c sat values for CALVADOS 1 (orange) and CALVADOS 2 (blue). Pearson’s r coefficients are reported in the legend. Small squares in C show the same data as in Figure 6 C– F whereas the large upward triangle, downward triangle, and circle show values for A2 LCD, FUS LCD, and Ddx4 LCD, respectively, at the conditions reported in Table 4.

