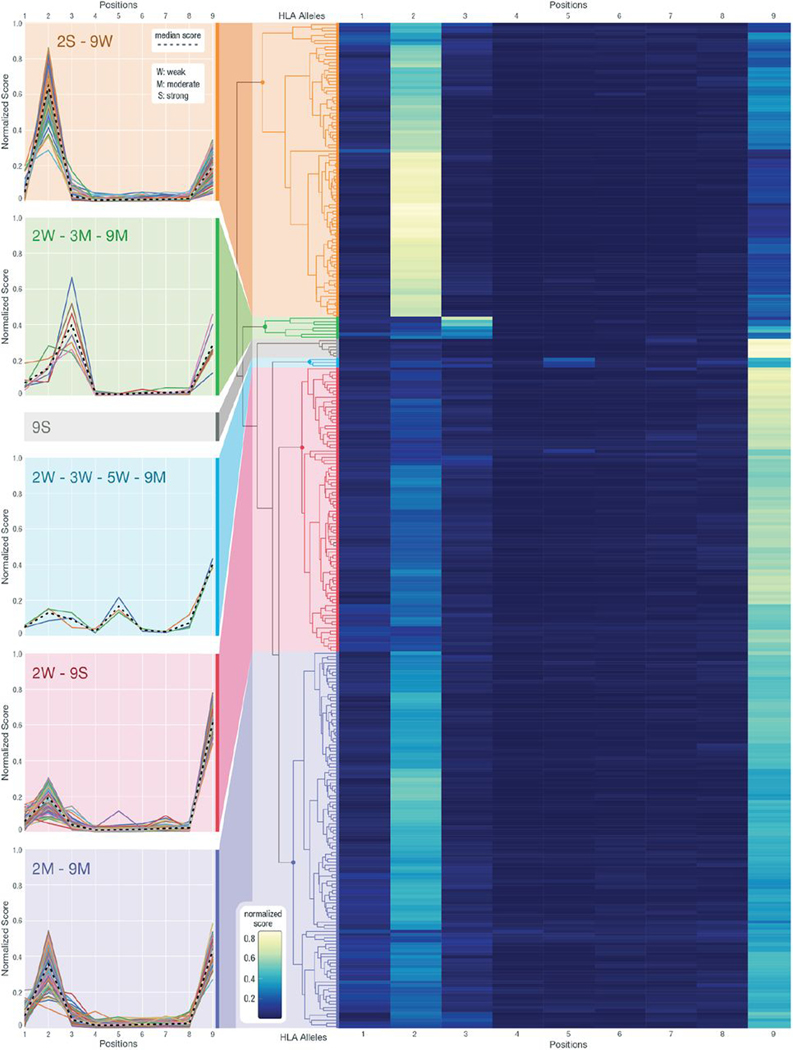
Fig. 3. Hierarchical clustering of anchor prediction scores across all 9-mer peptides.
Anchor prediction scores clustered using hierarchical clustering with average linkage for all 318 HLA alleles for which 9-mer peptide data were collected (of the 328 HLA alleles, 10 did not have corresponding 9-mer data). For the heatmap, the x axis represents the nine peptide positions, and the y axis represents 318 HLA alleles. Example HLA clusters have been highlighted with various color bands, and the score trends for individual HLA alleles are plotted. In the cluster line plots on the left, the x axis shows the peptide positions, whereas the y axis corresponds to the anchor score, normalized across all peptide positions. Different annotations have been given to help summarize the trends observed in individual clusters, where numbers represent positions, and letters represent its strength as a potential anchor in comparison with other anchors (S, strong; M, moderate; and W, weak). The median scores for each cluster are presented with a dashed line.

