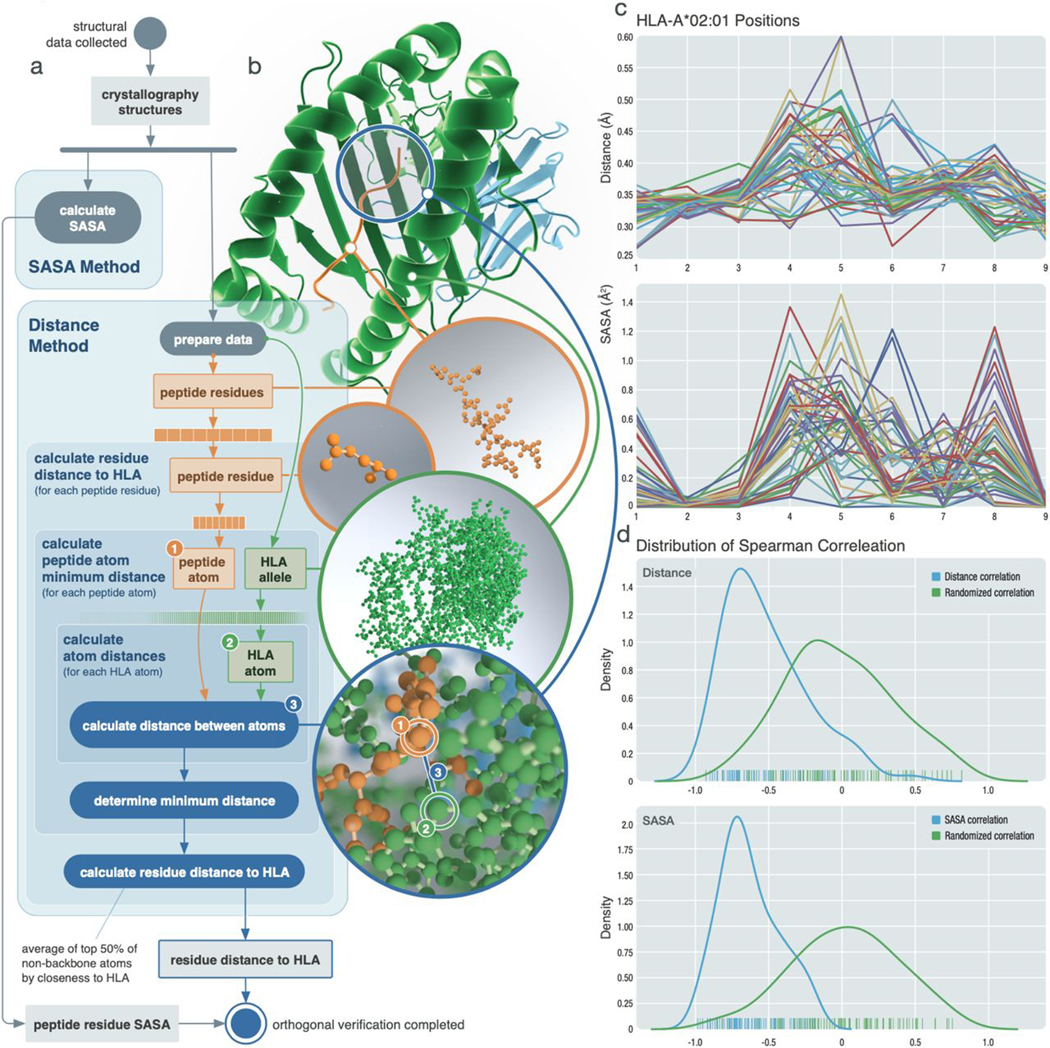
Fig. 4. Orthogonal validation using protein crystallography structures.

Orthogonal validation of predicted anchor scores using x-ray crystallography structures. (A) Schematic of analysis workflow for each HLA-peptide structure collected. For the distance metric, backbone atoms were excluded, with the exception of glycine. (B) Structural example of HLA-B*08:01 bound to peptide FLRGRAYGL (PDB ID: 3X13). (C) Example results of 47 structures collected for HLA-A*02:01 with 9-mer peptides. (Top) Distance measurements for each position. (Bottom) SASA measurements. (D) Distribution of Spearman correlations calculated between distance and prediction scores (top) and SASA and prediction scores (bottom). The blue line represents each respective correlation distribution, whereas the green line shows the distribution of Spearman correlation values obtained from randomly shuffled peptide positions.
