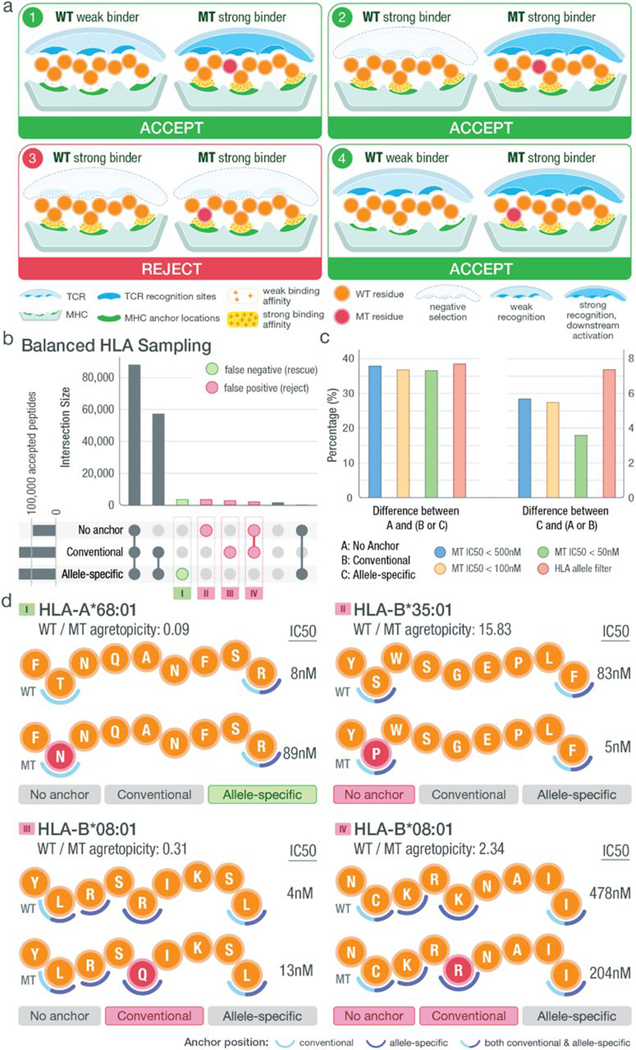
Fig. 7. Impact of anchor position information on neoantigen prioritization decisions.
(A) Illustration of different scenarios that could be encountered when prioritizing neoantigens. Each circle represents a peptide residue with WT residues indicated by orange and MT residues by red. Anchor locations of the MHC are marked in green, whereas TCR recognition sites are in blue. Predicted binding affinities of the MT/WT peptides are indicated using a yellow density field, where higher density represents strong binding and lower density represents weak binding. For putative strong binding MT peptides (IC50 < 500 nM), the four different scenarios are depicted with the proposed varying classification (accept/reject). The classification in each scenario depends on the WT binding and location of the MT residue, with respect to predicted anchor position(s). Given weak WT binding (IC50 > 500 nM), regardless of the mutation’s anchor status, a strong MT binder is accepted as a neoantigen candidate (scenarios 1 and 4). However, given a strong WT binder, a peptide is accepted in the case where the MT residue is not at an anchor (scenario 2) and rejected when the MT residue is at a predicted anchor (scenario 3) because these peptides may be subject to central tolerance. (B) Upset plot showing the number of intersecting peptides based on those prioritized with no anchor filter (binding affinity < 500 nM and agretopicity > 1), conventional filter (filtering based on conventional anchor assumptions), or allelespecific filter (filtering based on our computationally predicted anchor locations). Samples included for analysis were chosen such that HLA alleles were balanced appropriately. Peptides characterized differently between no anchor/conventional filter and allele-specific filter were categorized into false negatives (green circle) and false positives (red circle) with the assumption that the allele-specific filter produced more accurate results. (C) Bar plot showing the percentage difference among accepted neoantigen candidates based on filters discussed in (B). The filters in the legend represent how each starting dataset was filtered: (i) filtered by a strong binding cutoff of either 500, 100, or 50 nM and (ii) filtered on the basis of the anchor patterns of the corresponding HLA allele. Our HLA allele filter excluded all peptides binding to HLA alleles with a canonical anchor pattern (e.g., [2,9] for 9-mer peptides). (D) Examples of false-positive and false-negative peptides from each of the four subsets as marked in (B). Matching HLA allele, peptide sequence, mutation position (red), median WT/MT IC50 values, and fold changes are shown accordingly. Two sets of anchor locations are depicted for each scenario using semicircles: Conventional anchors are marked with light blue, and allele-specific anchors are marked with dark blue. Positions where the two sets of anchors overlap are marked with split coloring of the semicircle.

