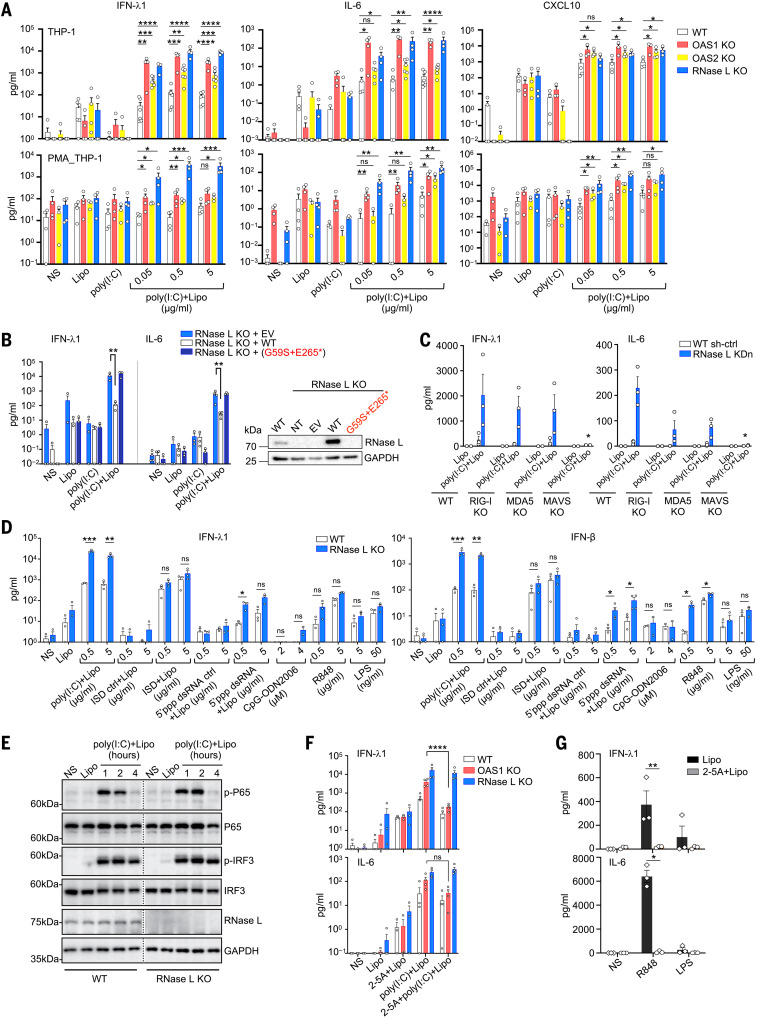
Fig. 3. Exaggerated inflammatory responses of OAS–RNase L-deficient THP-1 cells.
(A) Concentrations of various cytokines in the supernatant of OAS1 KO, OAS2 KO, RNase L KO, or parental THP-1 cells (upper panels) or PMA-primed THP-1 cells (lower panels) treated as indicated for 24 hours. (B) IFN-λ1 and IL-6 concentrations in the supernatant of RNase L KO THP-1 cells transduced with the WT or P5’s variant RNASEL cDNA, or empty vector (EV), and treated as indicated for 24 hours. On the right, RNase L protein levels, as assessed by immunoblotting. NT, not transfected. (C) IFN-λ1 and IL-6 concentrations in the supernatant of parental, RIG-I KO, MDA5 KO, or MAVS KO THP-1 cells with or without (WT sh-ctrl) RNase L knockdown (KDn), treated as indicated for 24 hours. (D) IFN-λ1 and IFN-β concentrations in the supernatant of parental or RNase L KO THP-1 cells, treated as indicated for 24 hours. (E) Immunoblot of phosphorylated P65 and IRF3 in parental and RNase L KO THP-1 cells treated as indicated. The results shown are representative of two independent experiments. (F) IFN-λ1 and IL-6 concentrations in the supernatant of parental, OAS1 KO, or RNase L KO THP-1 cells treated as indicated for 24 hours. (G) IFN-λ1 and IL-6 concentrations in WT THP-1 cells treated as indicated for 24 hours. In (A) to (D), (F), and (G), the data points are means ± SEM from three to five independent experiments with one to two technical replicates per experiment. Statistical analysis was performed as described in the methods. ns, not significant; *P < 0.05, **P < 0.01, ***P < 0.001, ****P < 0.0001. NS, nonstimulated; Lipo, lipofectamine only; poly(I:C), extracellularly added poly(I:C); poly(I:C)+Lipo, intracellular poly(I:C) in the presence of lipofectamine; 2-5A+Lipo, intracellular 2-5A in the presence of lipofectamine; 2-5A+poly(I:C)+Lipo, intracellular poly(I:C) in addition to intracellular 2-5A.

