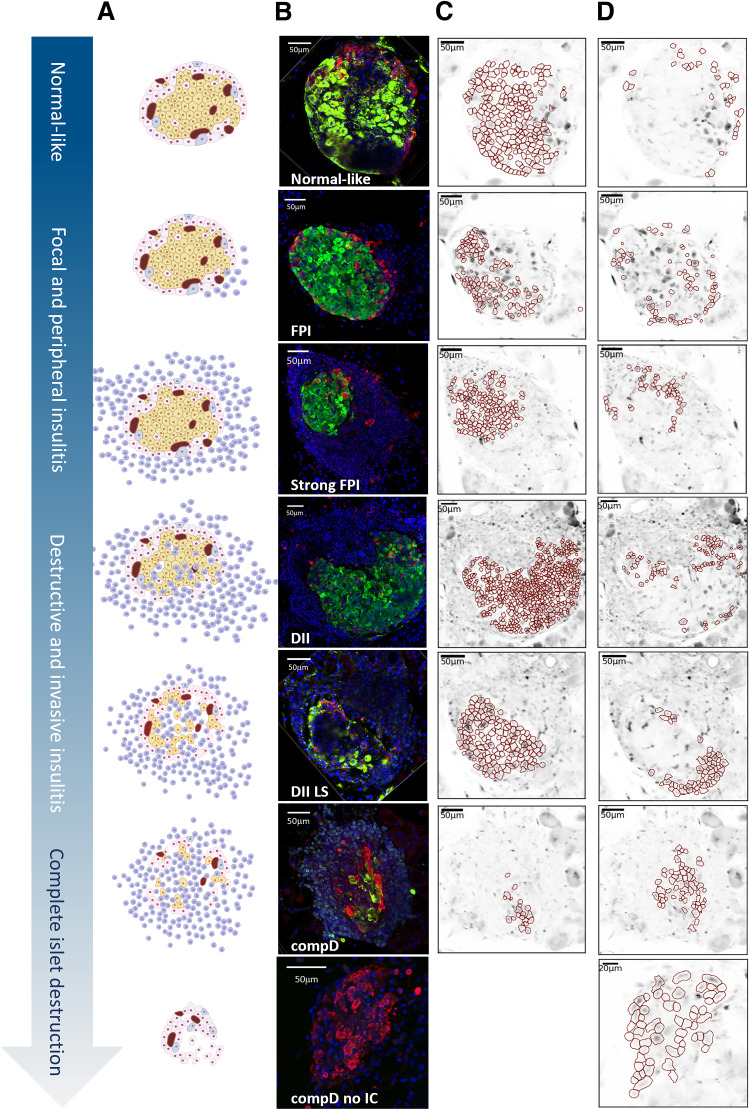
Figure 1.
Categorization of islets along the severity of T1D diseases. (A) Schematic diagram showing islets with progressive severity of immunogenic assault and β-cell destruction. (B) Representative islets of each islet group immunoassayed for insulin (green), glucagon (red), and DAPI (blue). Note the normal-like islet shown. This islet has a compact encapsulated structure, insulin- and glucagon-positive cells distributed in accordance with a rodent islet, and no immune cells infiltration observed, and the dynamic Ca2+ responses of the β- and α-cells within resembled those in the other islets of the same group; hence, we concluded that the hollows shown in this islet resulted from further processing of the tissue for immunoassays, and have included this islet in the normal-like group. (C and D) ROIs (in red) representing β-cells (C) and in α-cells (D).

