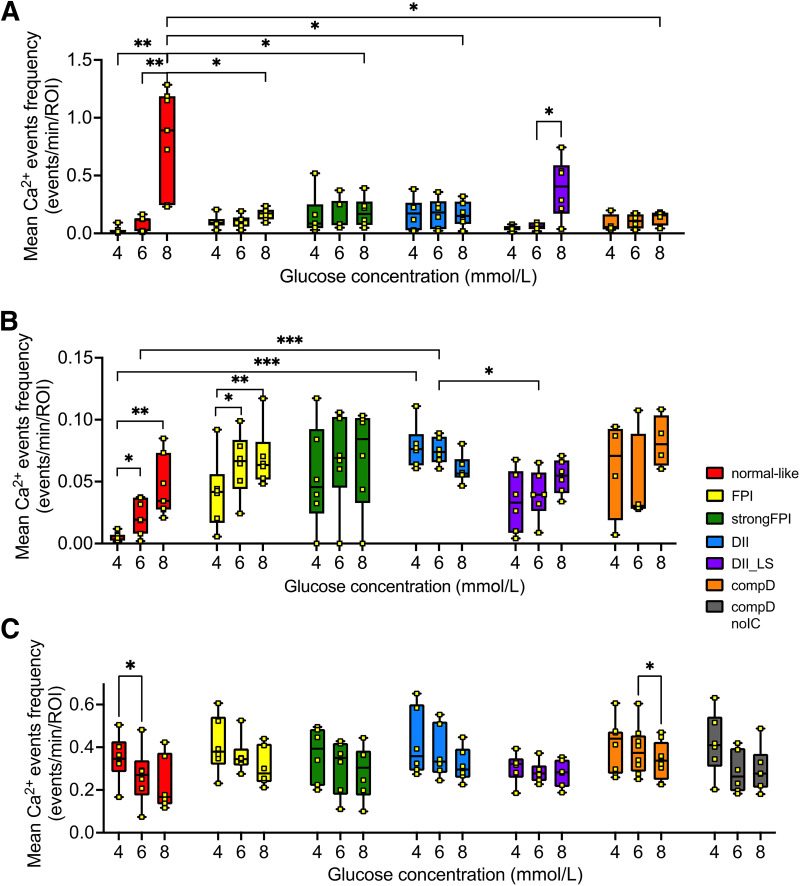
Figure 4.
Quantification of [Ca2+]c events in α- and β-cells across all islet groups. (A) Short (half-width between 2.5 and 20.0 s) and (B) long (half-width between 20.1 and 200.0 s) [Ca2+]c events of β-cells and (C) all [Ca2+]c events of α-cells (2.5–200.0 s, no segregation of short/long events as no different trends were observed) across all islet groups in response to 4, 6, and 8 mmol/L glucose were quantified into mean frequencies. Note an extra compD no IC group in C but not shown in A, as no insulin-positive cells were found in islets within this group. Statistical significance is indicated as *P < 0.05; **P < 0.01; ***P < 0.001.

