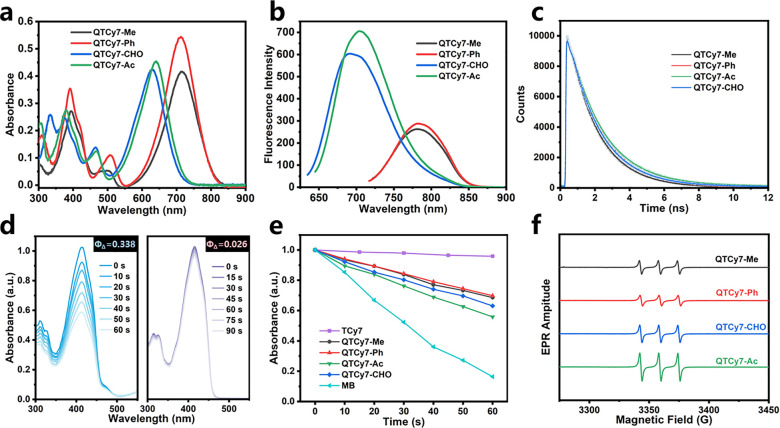
Figure 2.
Spectral tests of QTCy7-R. (a) UV–vis absorption spectra and (b) fluorescence emission spectra of QTCy7-R (5 μM) in DCM. (c) Time-correlated single-photon counting fluorescence intensity decay of QTCy7-R. (d) DPBF degradation induced by QTCy7-Ac (left) and TCy7 (right) under 660 nm irradiation (2 mW/cm2). (e) Normalized DPBF degradation (415 nm) caused by different compounds under 660 nm irradiation in DCM. (f) EPR signals of 1O2 induced by different compounds under 660 nm irradiation in DCM.

