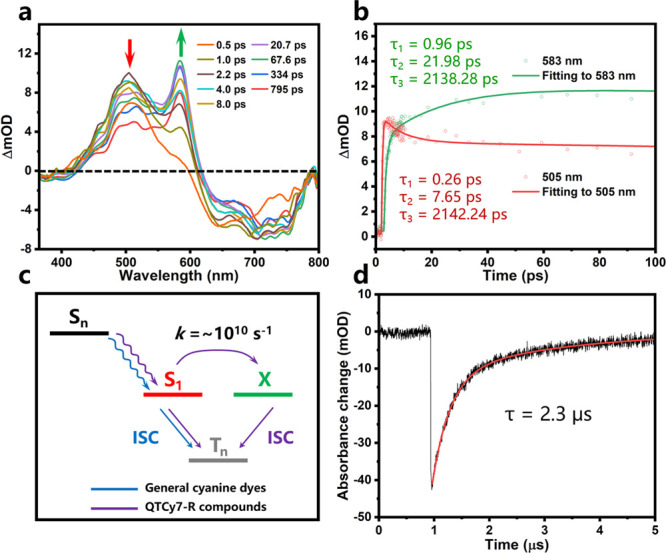
Figure 3.

(a) Femtosecond transient absorption spectroscopy (fs-TA) analysis for QTCy7-Ac at different pump–probe delay times. Different color lines represent spectra at different times; λex = 350 nm. (b) Kinetic traces and fitting lines of QTCy7-Ac taken through the representative ESA wavelength. (c) Schematic diagram of intersystem crossing process of excited states in general cyanine dyes and QTCy7-R compounds. (d) Kinetic traces of the triplet state of QTCy7-Ac (5 μM) in deaerated dichloromethane at 635 nm. λex = 610 nm.
