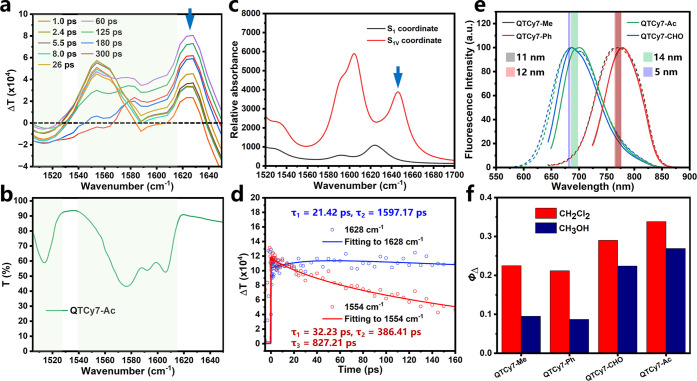
Figure 6.
TRIR experiments and the comparison of excited-state properties between the DCM and MeOH of QTCy7-R. (a) TRIR spectra for QTCy7-Ac at different pump–probe delay times. Different colored lines represent spectra at different times. (b) FTIR spectrum for QTCy7-Ac.(c) Simulated IR spectra for QTCy7-Ac at the S1 and S1V coordinates. (d) Kinetic traces and fitting lines of QTCy7-Ac taken through 1554 and 1628 cm–1. (e) Comparison of normalized emission spectra of QTCy7-R in dichloromethane and methanol. Solid lines represent spectra in dichloromethane, and dashed lines represent spectra in methanol. (f) Comparison of ΦΔ of QTCy7-R in methanol and dichloromethane.

