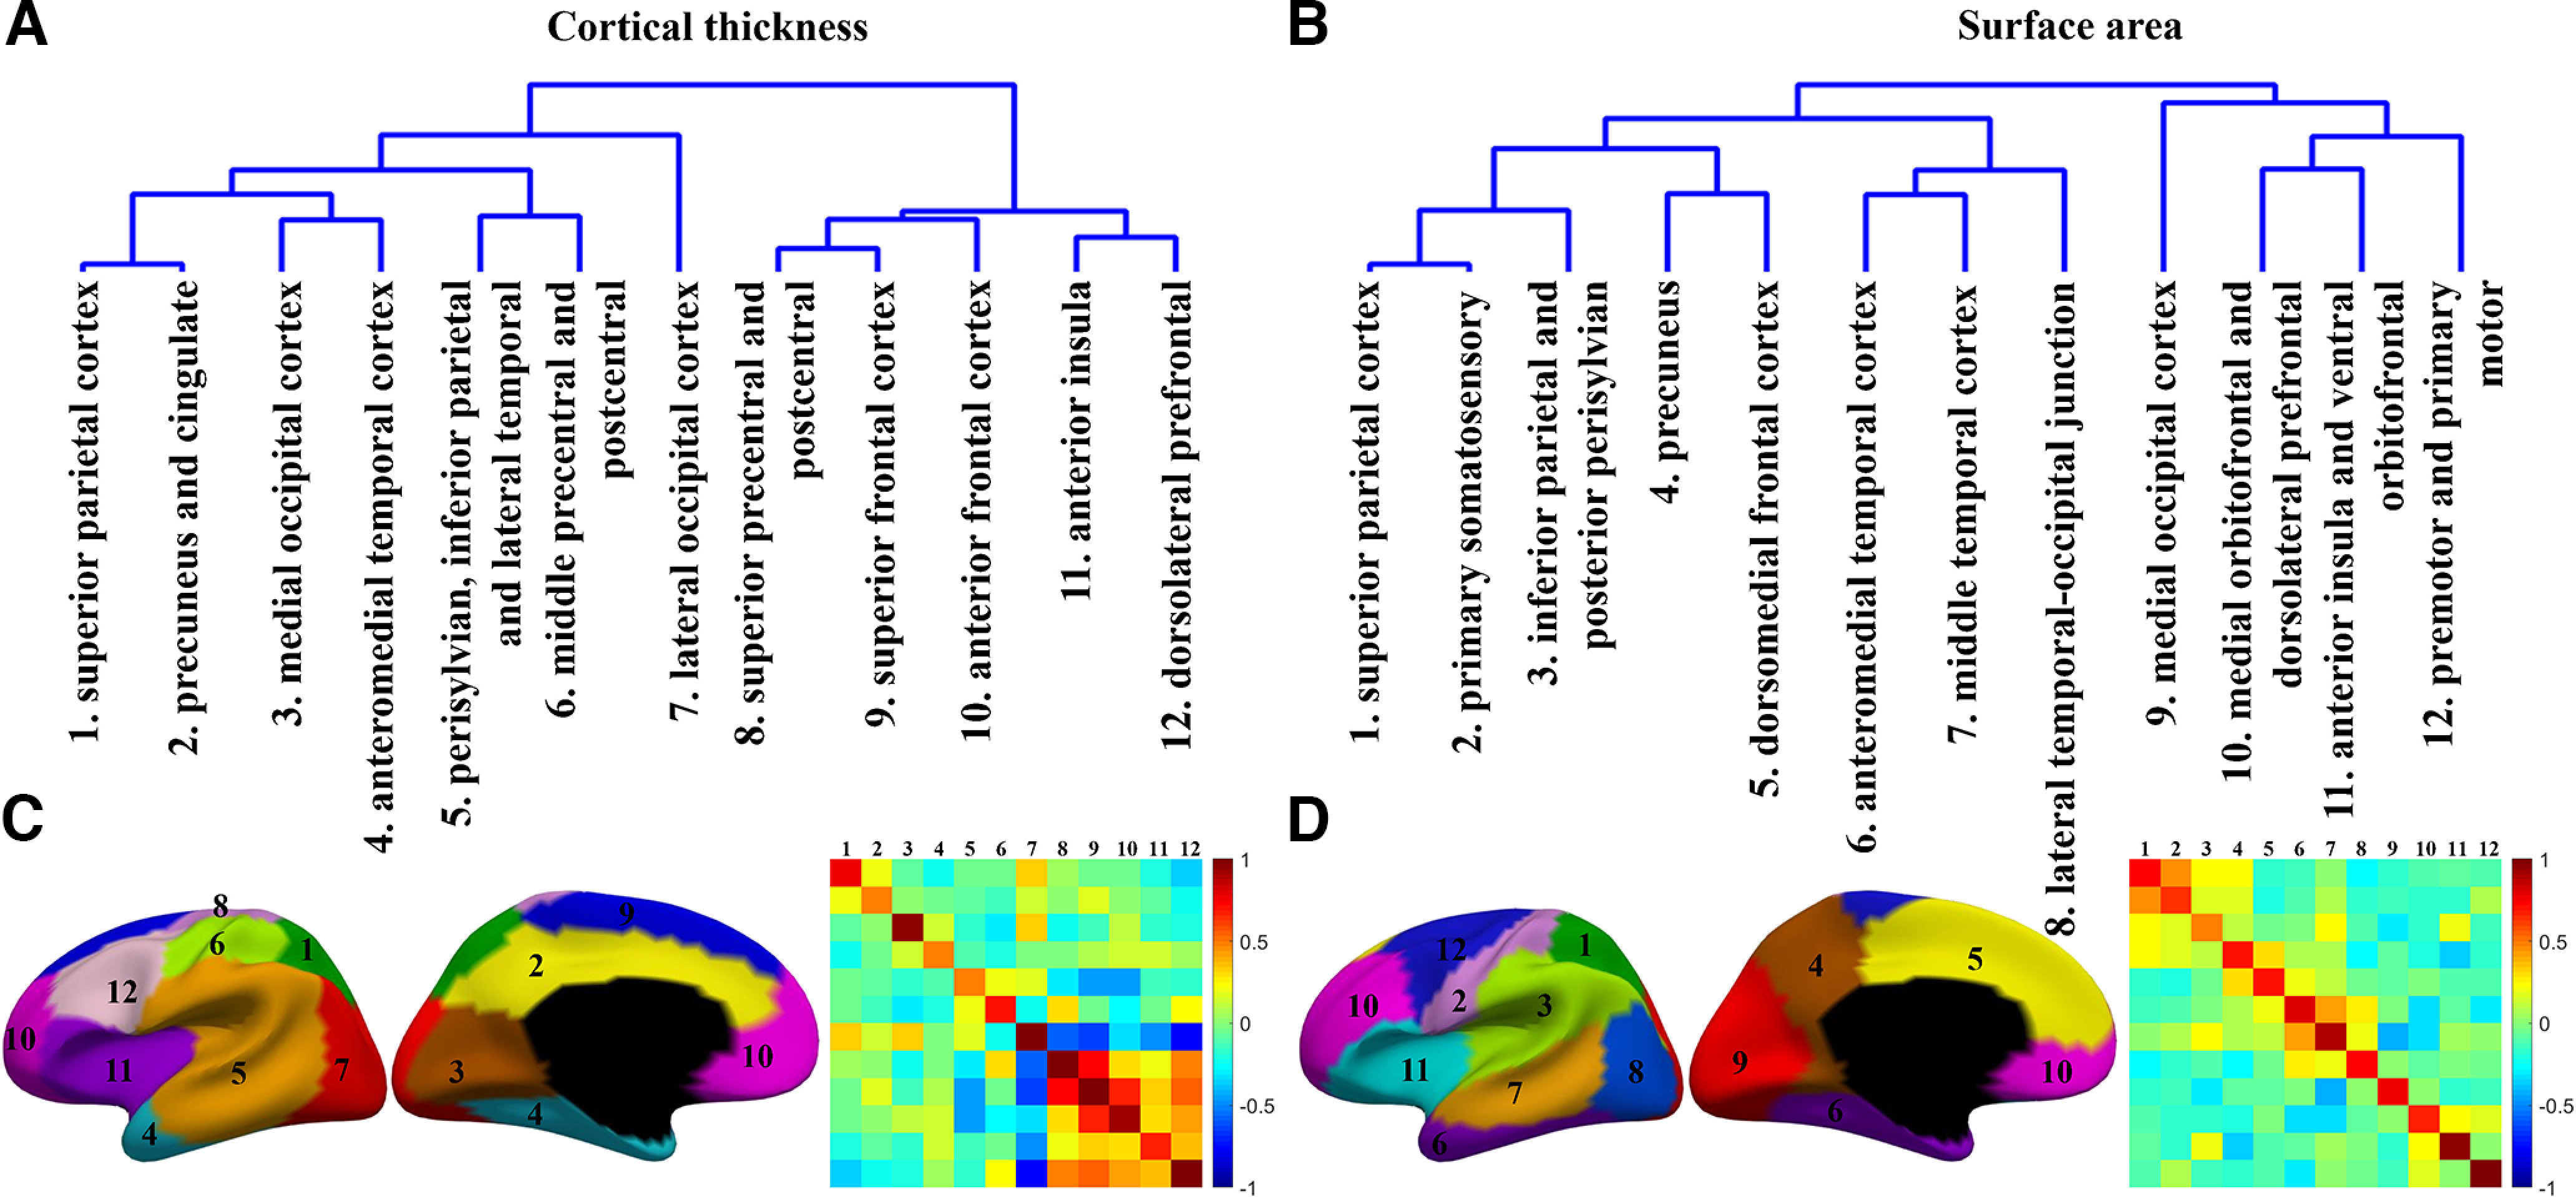
Figure 6.

Hierarchical organization of our discovered genetic regions in neonates. A, B, Dendrograms derived from 12 regions based on the pair-wise genetic similarity matrix among clusters of CT and SA, respectively. C, D, Corresponding genetic parcellation maps with region locations labeled in number. Heatmaps represent the pair-wise genetic similarity matrix among regions of CT (C) and SA (D).
