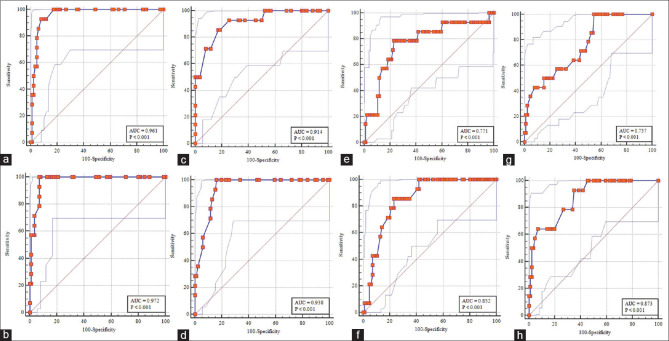
Figure 2.
ROC curve analysis showing the area under the curve (AUC) for the prediction of IABP insertion. (a) pre-revascularization GLS; (b) post-revascularization GLS; (c) pre-revascularization 3D LV EF; (d) post-revascularization 3D LV EF; (e) pre-revascularization E/e’; (f) post-revascularization E/e’; (g) pre-revascularization WMSI; (h) post-revascularization WMSI)

