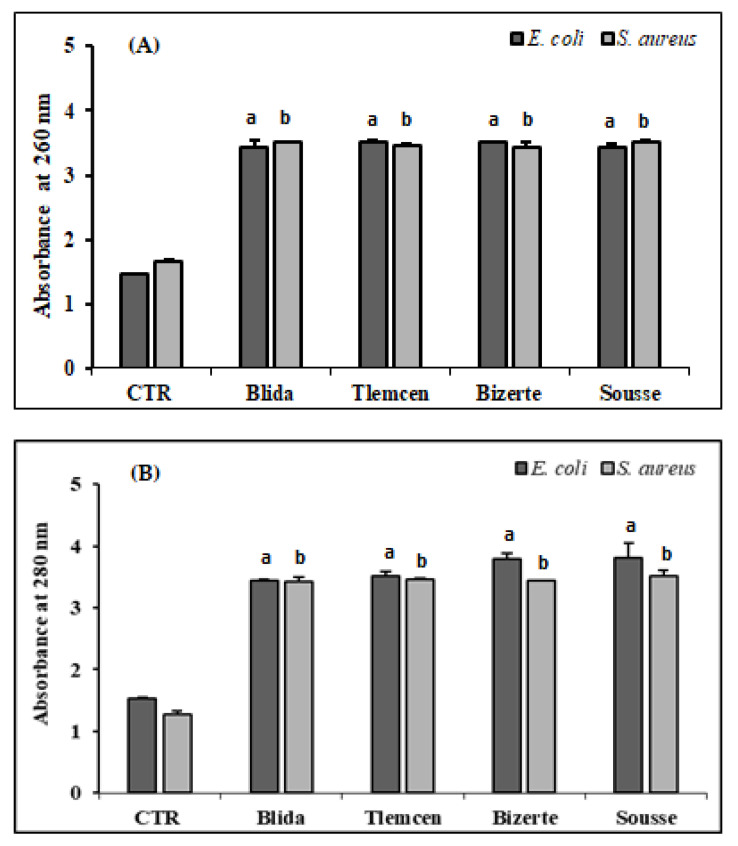
Figure 2.
Release of cell content of S. aureus ATCC 25923 and E.coli ATCC 25922 evaluated by measuring and quantifying the absorbance at 260 nm (A) and 280 nm (B) treated with methanolic extracts of A. altissima from different regions. Control (CTR): bacteria were untreated with plant extracts. Results are expressed as mean ± SD. Absorbance values are expressed as mean ± SD. Comparison of absorbance between CTR and E. coli or S. aureus treated with leaf extracts from each studied region were performed using the unpaired two-tailed Student’s t-test. Significant differences among tested groups are indicated by different letters. a p < 0.001 E. coli values significantly different from CTR and b p < 0.001 S. aureus values significantly different from CTR.

