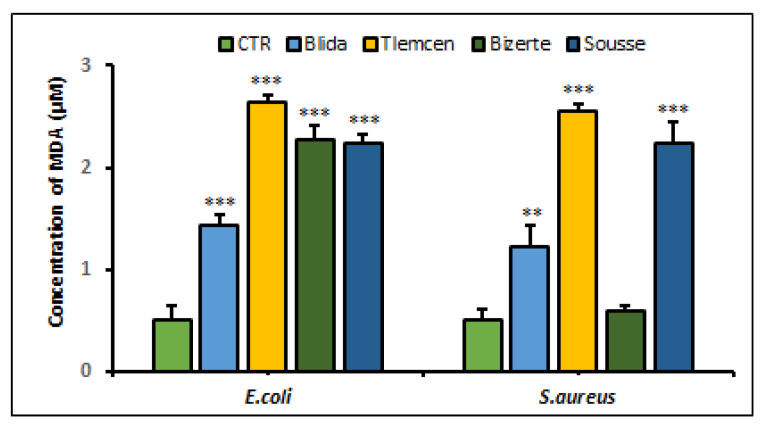
Figure 4.
Quantification of MDA production by E. coli ATCC 25922 and S. aureus ATCC 25923 after 24 h of treatment with extracts of A. altissima from different studied regions. Control (CTR): bacteria were untreated with plant extracts. MDA levels are expressed as mean ± SD. Comparison of MDA rates between CTR and E. coli or S. aureus treated with leaf extracts from each studied region were performed using the unpaired two-tailed Student’s t-test. ** p < 0.01 and *** p < 0.001 significantly different from CTR.

