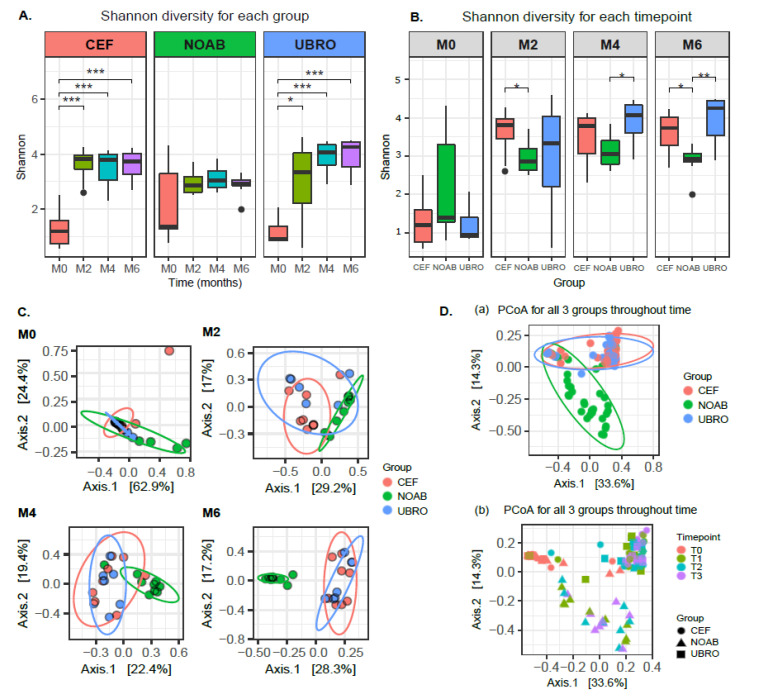
Figure 1.
(A) Alpha diversity of milk microbiota using Shannon index between all time-points for each group. The plot shows significant differences in diversity between milk obtained at M0, M2, M4 and M6 for both the antibiotic-treated groups (UBRO and CEF). (B) Alpha diversity using Shannon index between the three groups (NOAB, UBRO and CEF) at all time-points. Plot shows no significant difference between groups at M0, while significance between antibiotic and no-antibiotic group was seen at later time points. (C) PCoA plot using Bray–Curtis distance matrix between the three groups at all time-points, showing distinct clustering between groups. (D) PCoA plot using Bray–Curtis distances (a) showing distinct clustering of all three groups, with antibiotic groups clustering discretely compared to the no-antibiotic group; and plot (b) showing separate grouping of points between groups and time-points. * p-value ≤ 0.05; ** p-value ≤ 0.01; *** p-value ≤ 0.001.

