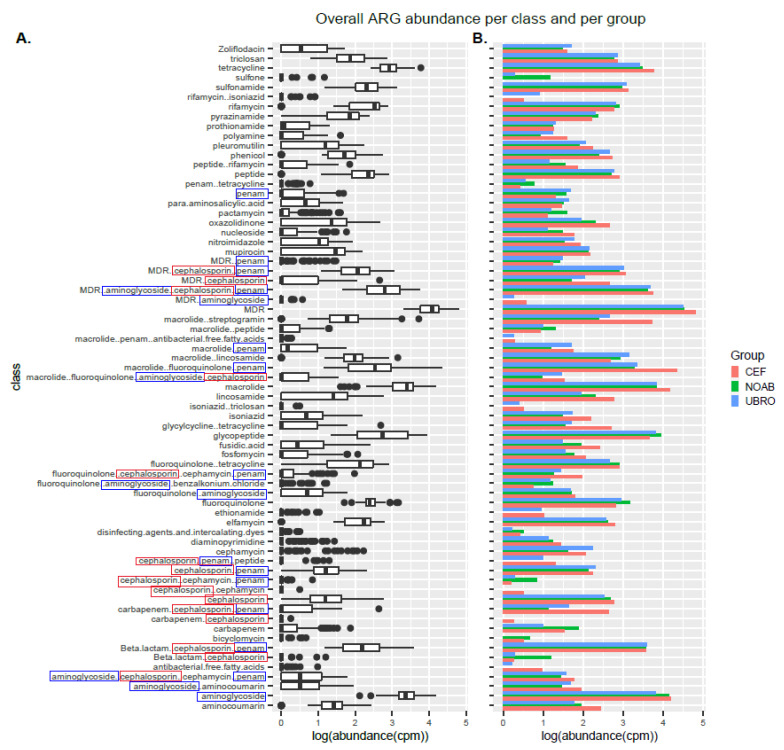
Figure 4.
(A) Boxplot showing log-transformed abundance of the different classes of antibiotics to which resistance was observed in this study. (B) Bar plot showing representation of ARGs in all three groups (NOAB, UBRO and CEF) over all time-points. The classes highlighted in blue boxes correspond to the class of antibiotics administered to the UBRO group, while those in red boxes correspond to the CEF group.

