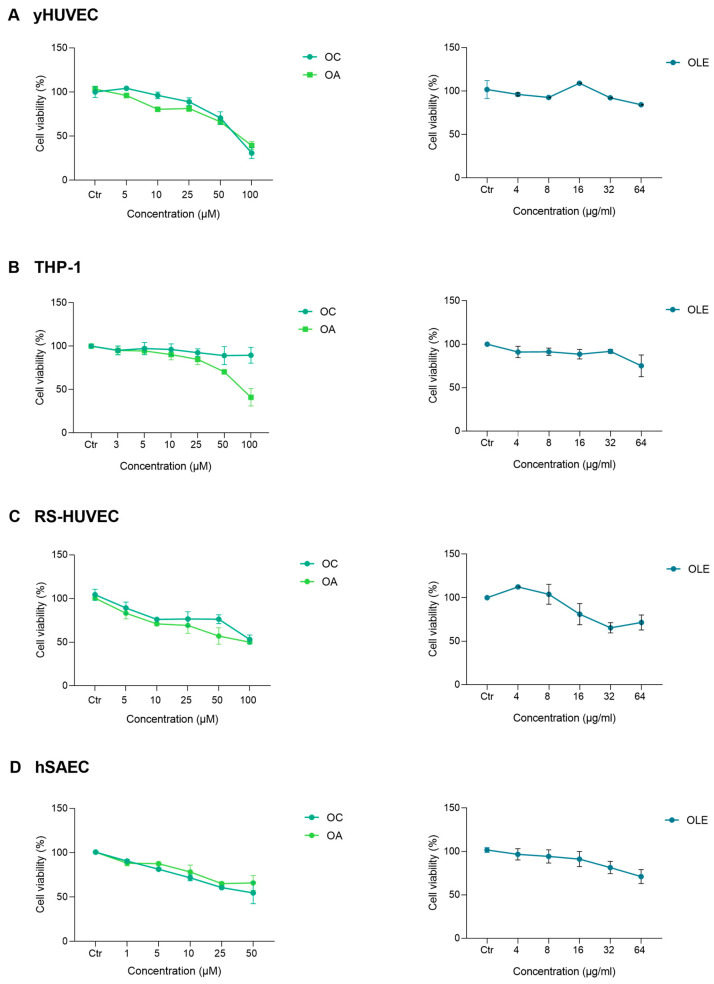
Figure 2.
Effect of OLE, OC and OA on HUVEC, THP-1 and hSAEC cell viability. Cells were treated with OLE (from 4 to 64 μg/mL), OC and OA (from 1 to 100 μM) for 24 h. The results are expressed as a percentage of cell viability normalised to the viability of DMSO-treated cells (CTR) and represented as mean value ± SEM from three independent experiments. (A) yHUVECs. (B) RS-HUVECs. (C) THP-1. (D) hSAECs.

