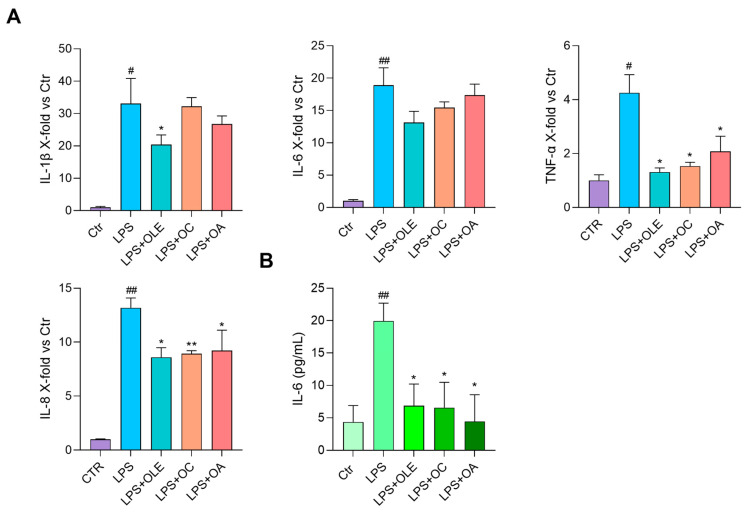
Figure 4.
Anti-inflammatory activity of OLE, OC and OA in LPS-stimulated THP-1 cells. Cells were pre-treated with OLE (4 μg/mL), OC and OA (5 μM) for 2 h and stimulated with LPS (500 ng/mL) for 3 h. (A) IL-1β, IL-6, TNF-α and IL-8 mRNA expression. Data are reported as fold change vs. untreated LPS-stimulated THP-1 according to 2−ΔΔCt method and using β-actin as housekeeping. (B) IL-6 (pg/mL) in cell lysates; histograms represent the mean of three independent experiments ± SD. Paired t test, * p < 0.05, ** p < 0.01 vs. THP-1 + LPS (LPS); # p < 0.05, ## p < 0.01 vs. LPS-untreated THP-1 (Ctr).

