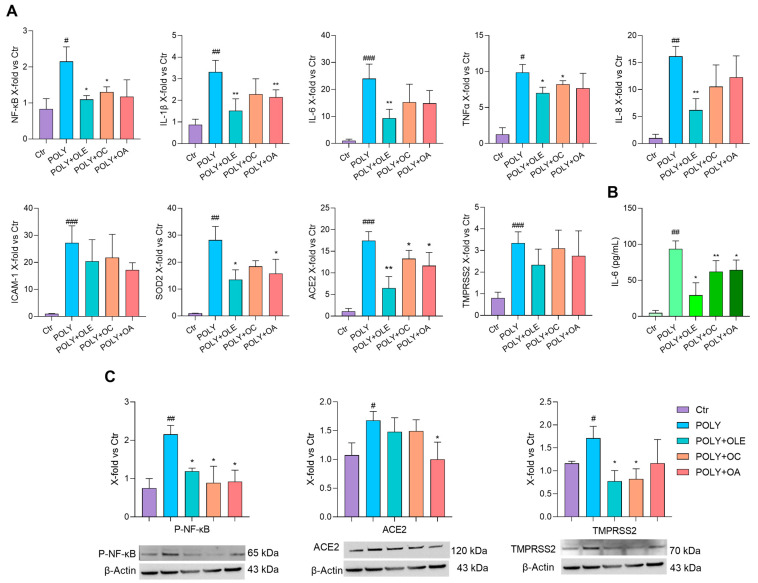
Figure 6.
OLE, OC and OA anti-inflammatory and anti-viral effects on hSAEC cells. Cells were pre-treated with OLE (4 μg/mL), OC (1 μM) and OA (5 μM) for 2 h and then stimulated with Poly(I:C) for 24 h. (A) NF-kB, IL-1β, IL-6, TNFα, IL-8, ICAM-1, SOD2, ACE2 and TMPRSS2 mRNA expression. Data are shown as fold change vs. untreated Poly(I:C)-stimulated hSAEC according to 2-ΔΔCt method, using actin as housekeeping. (B) IL-6 (pg/mL) in the culture medium. (C) Representative Western blot analysis showing P-NF-κB, ACE2 and TMPRSS2 protein expression, with β-actin as loading control. The results are expressed as mean ± SD from three independent biological replicates. Paired t test, # p < 0.05, ## p < 0.01, ### p < 0.001 vs. untreated hSAEC (CTR); * p < 0.05, ** p < 0.01 vs. Poly(I:C)-stimulated hSAEC (POLY).

