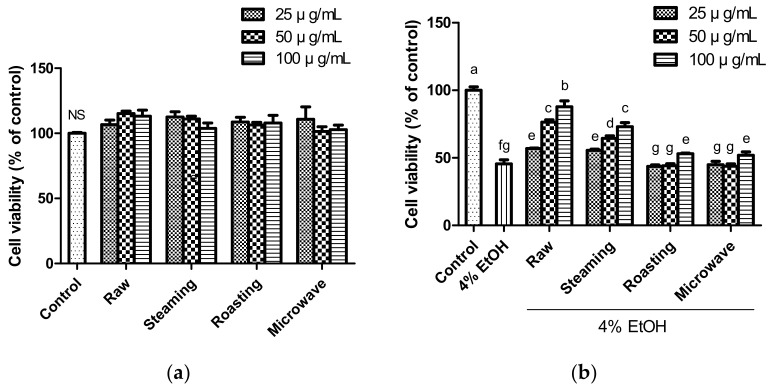
Figure 1.
Cytotoxicity of various concentration of purple sweet potato (a) and cytoprotective effect (b) of various concentration of samples (25, 50, and 100 µg/mL) against 4% ethanol-induced cytotoxicity. The vertical bars represent mean values ± SD and values marked by same letter are not significantly different (p < 0.05). NS, not significant.

