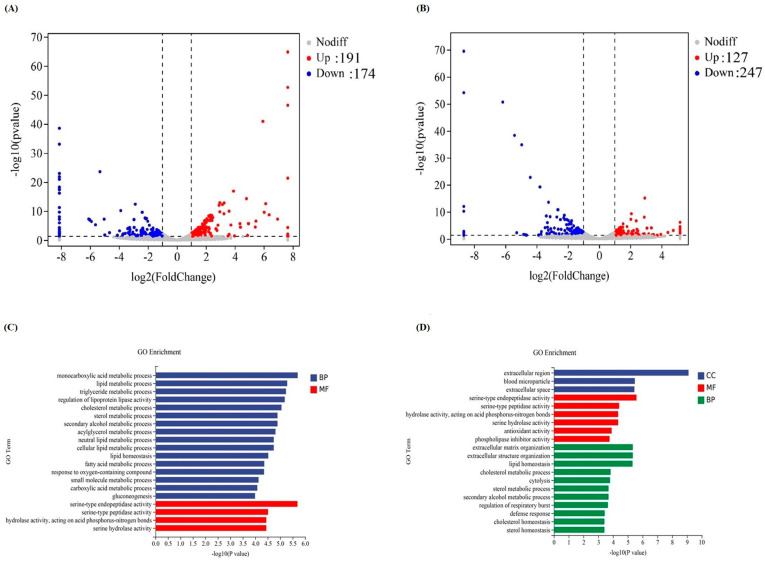
Figure 4.
Global changes of transcriptome-sequencing results. (A) Volcano plots of differentially expressed genes with CM0 vs. CM1. (B) Volcano plots of differentially expressed genes with CM0 vs. CM4. Downregulated genes are shown with blue dots (p < 0.05 and log2Foldchange < −1) and upregulated genes with red (p < 0.05 and log2Foldchange > 1). Genes with gray dots did not show differential expression. Gene ontology (GO) classification of the significantly differential genes (p < 0.05). The results are summarized in three main GO categories: biological process (BP), cellular component (CC), and molecular function (MF). (C) GO enrichment analysis of DEGs in CM0 vs. CM1. (D) GO enrichment analysis of DEGs in CM0 vs. CM4. The x-axis indicates the gene quantity, and the y-axis indicates the gene functional category. The categories are presented in different colors.

