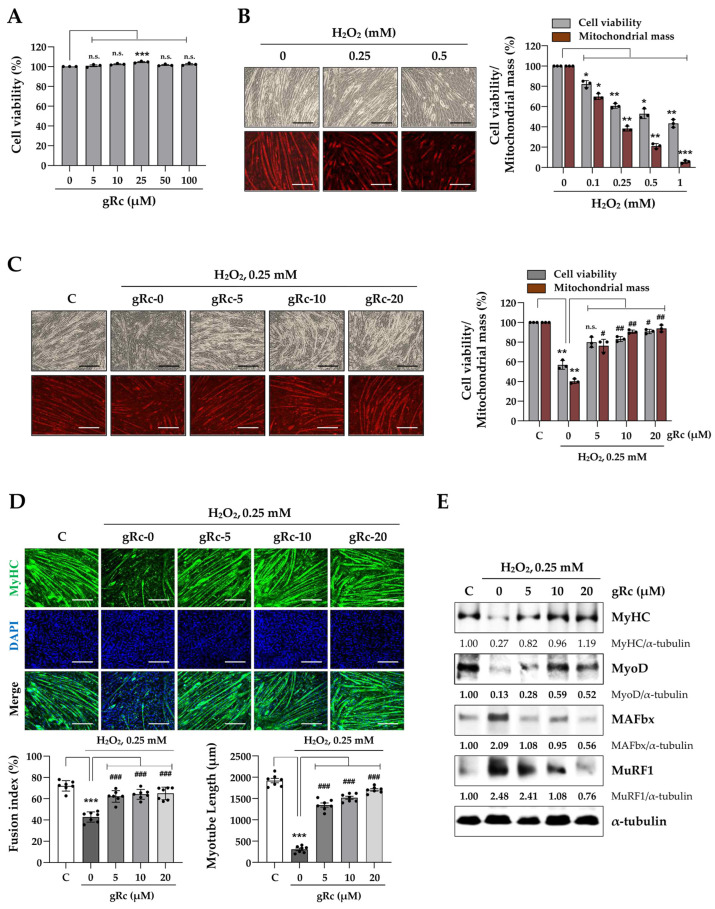
Figure 3.
Effects of gRc on H2O2-induced degradation of myotubes. (A) C2C12 myotubes were treated with gRc for 24 h and cell viability was measured. (B) Myotubes were treated with H2O2 up to 1 mM for 24 h. Relative cell viability and mitochondrial mass compared to vehicle-treated cells were expressed as the mean ± SEM (n = 3). Dots are individual values. (C) Myotubes were pretreated with gRc for 12 h and further incubated with H2O2. After 24 h, cell viability and mitochondrial mass were determined and relative values were expressed as the mean ± SEM (n = 3). Dots are individual values. (D) Myotubes were pretreated with gRc for 12 h and then treated with H2O2. After 24 h, cells were subjected to immunofluorescence staining for MyHC (green) and DAPI (blue). Fusion index and myotube length were quantitated and presented as the mean ± SEM (n = 7). Dots are individual values. (E) Effects of gRc on the expression of MyHC, MyoD, MAFbx, and MuRF1 in H2O2-treated myotubes were determined by Western blotting. * p < 0.05, ** p < 0.01, and *** p < 0.001 vs. vehicle-treated cells, # p < 0.05, ## p < 0.01, ### p < 0.001 vs. H2O2 + vehicle-treated cells; n.s., non-significant. Scale bar = 100 μm.

