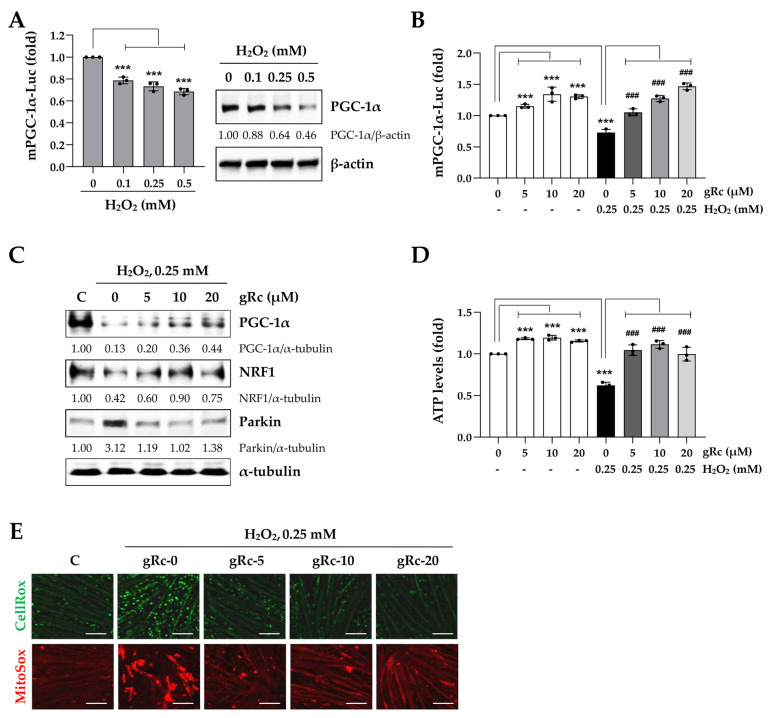
Figure 4.
Effects of gRc on the mitochondrial biogenesis and oxidative stress in H2O2-treated myotubes. (A) mPGC-1α promoter activity and PGC-1α protein level in myotubes were measured after treatment with H2O2. (B) mPGC-1α promoter activity in myotubes was measured after treatment with gRc alone or in combination with H2O2. Relative mPGC-1α activity was expressed as the mean ± SEM (n = 3). Dots are individual values. (C) The protein levels of PGC-1α, NRF1, and Parkin in H2O2-treated myotubes were measured by Western blotting. (D) After treatment with gRc alone or in combination with H2O2, ATP level was determined and presented as the mean ± SEM (n = 3). Dots are individual values. (E) Myotubes were pretreated with gRc and further incubated in the presence of H2O2. After 6 h, cellular ROS (green) and mitochondrial superoxide (red) were observed under a fluorescence microscope. *** p < 0.001 vs. vehicle-treated cells, ### p < 0.001 vs. H2O2 + vehicle-treated cells. Scale bar = 100 μm.

