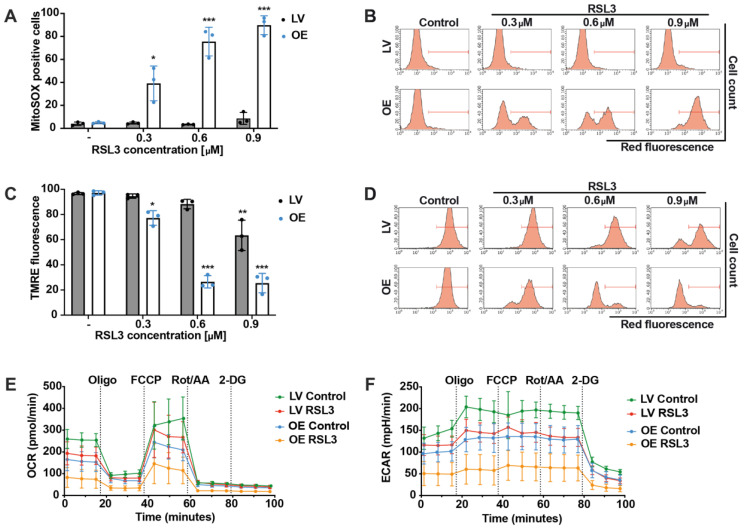
Figure 4.
FACS analysis and Seahorse measurement demonstrate mitochondrial involvement in ACSL4 and LPCAT2 OE cells. (A) Mitochondrial ROS formation and (C) mitochondrial membrane potential were quantified by FACS analysis of MitoSOX or TMRE stained cells after 0.3, 0.6, and 0.9 µM RSL3 treatment for 16 h (5000 cells per replicate of n = 3 replicates, calculated as percentage of gated cells). (B,D) Representative histograms of the respective FACS measurement with gating. (E) Mitochondrial respiration and (F) glycolysis were detected by the seahorse system after 16 h of 0.8 µM RSL3 treatment (n = 6–8 replicates per condition). *** p < 0.001; ** p < 0.01; and * p < 0.05 compared to untreated control conditions (ANOVA, Scheffé’s test).

